Category Archives: Interaction Design

Making ‘Dive into Color’

Guest post by Olivia Vane

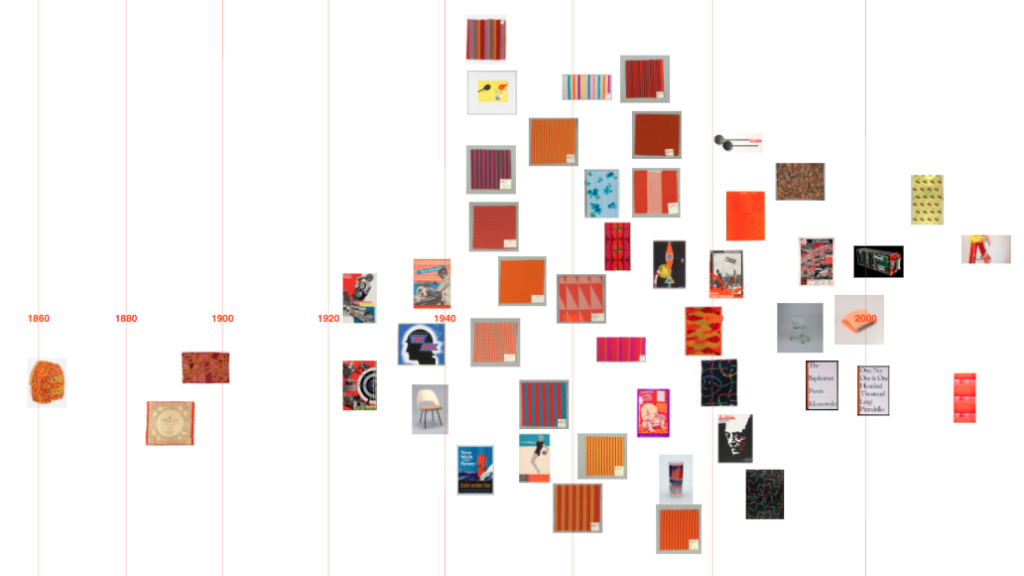
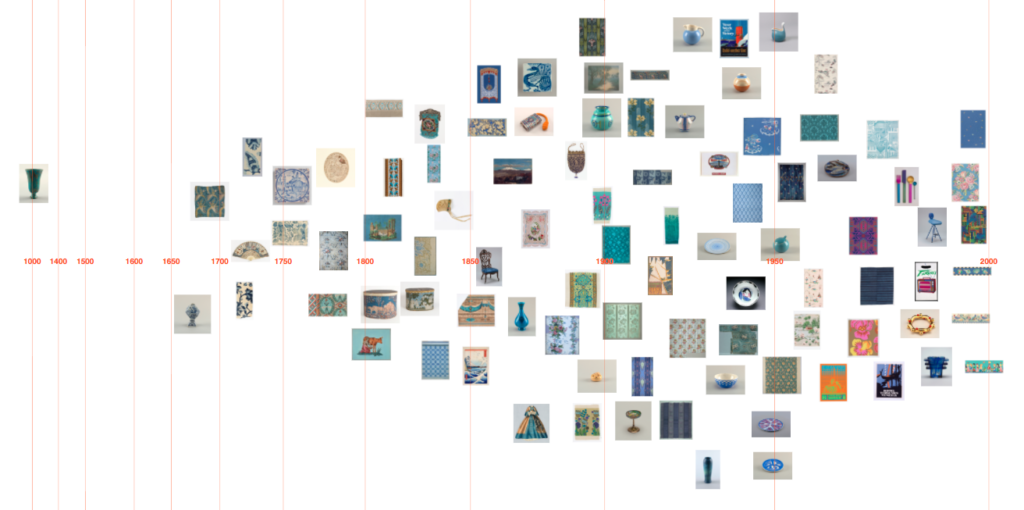
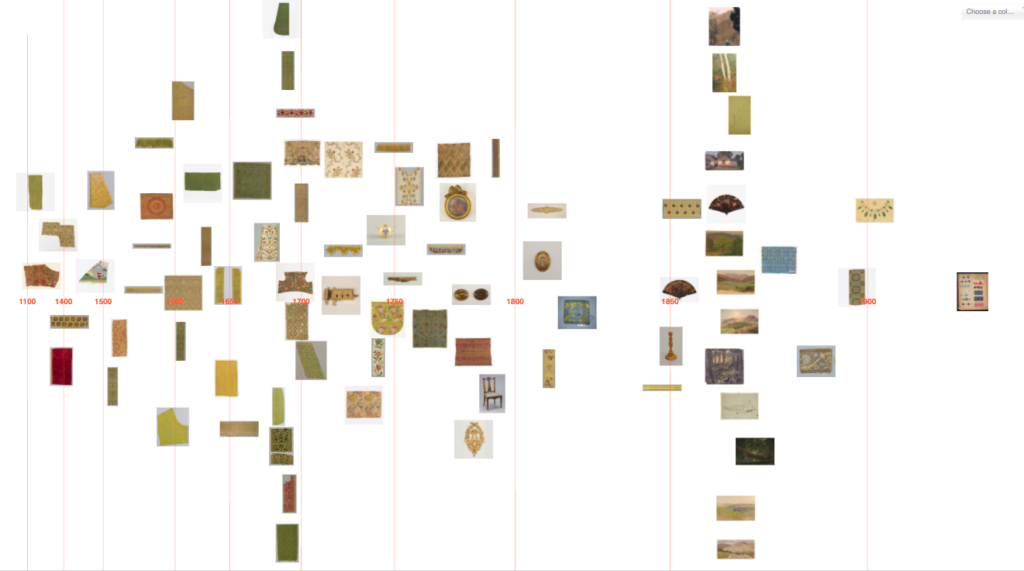
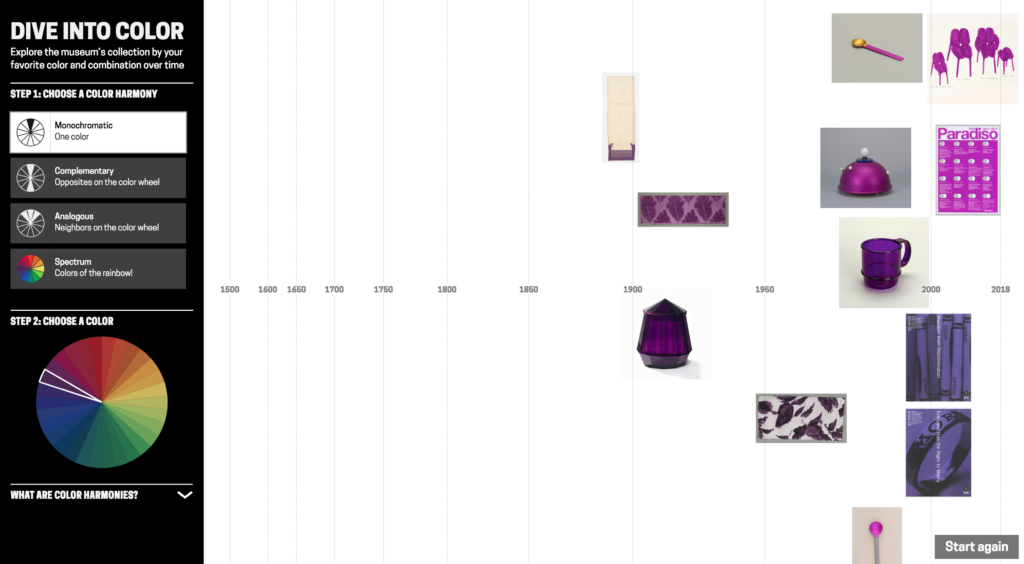
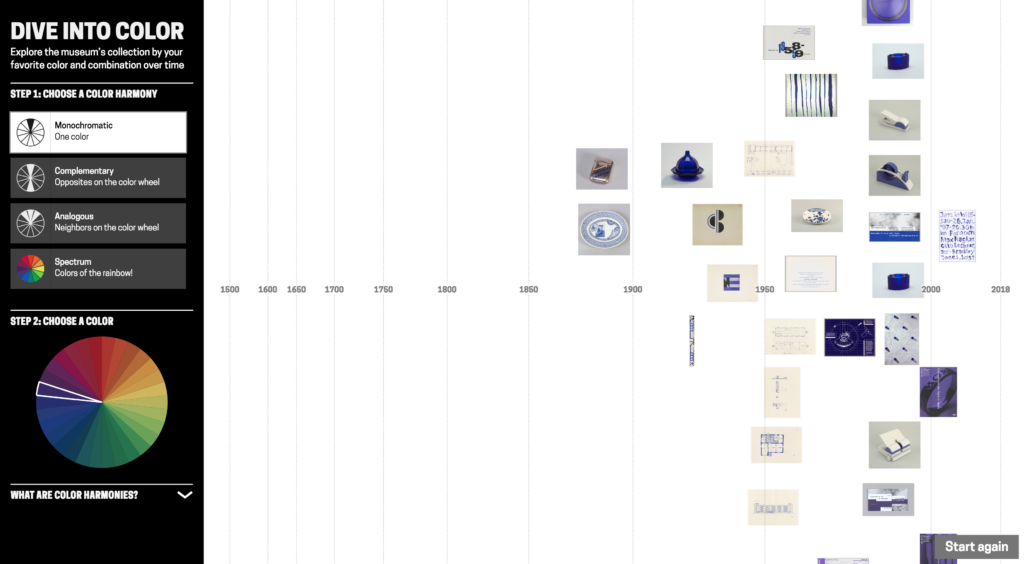
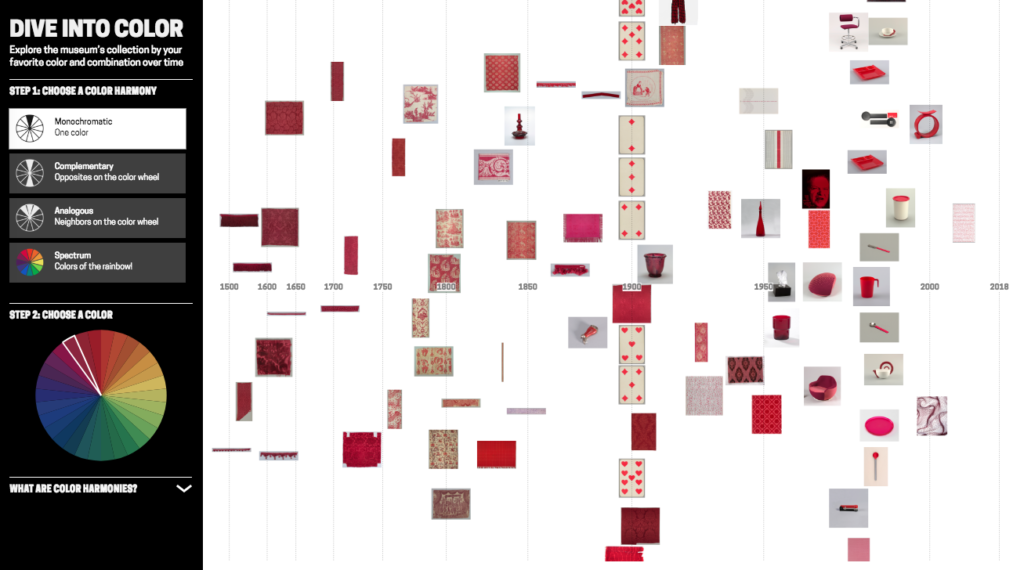
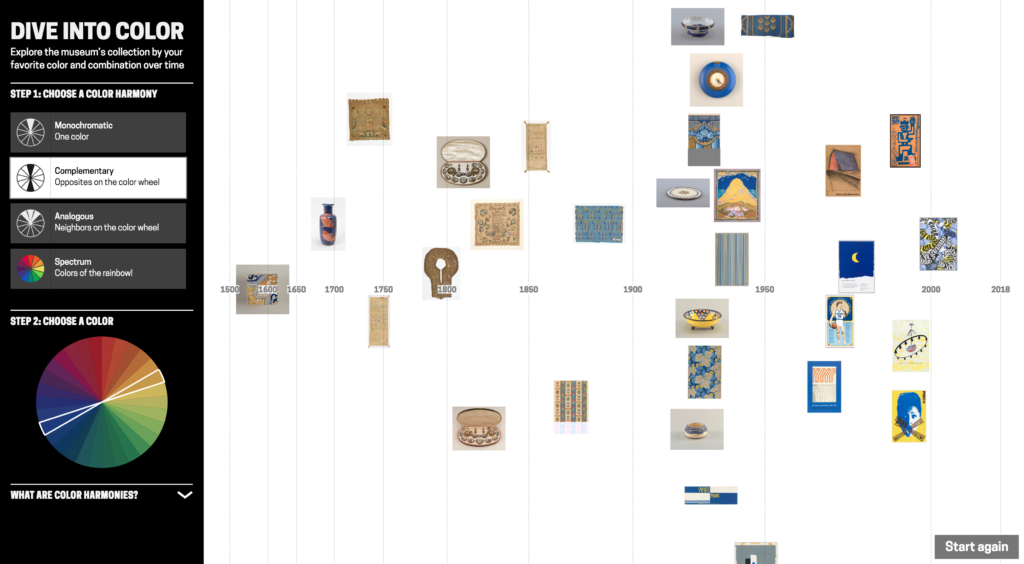
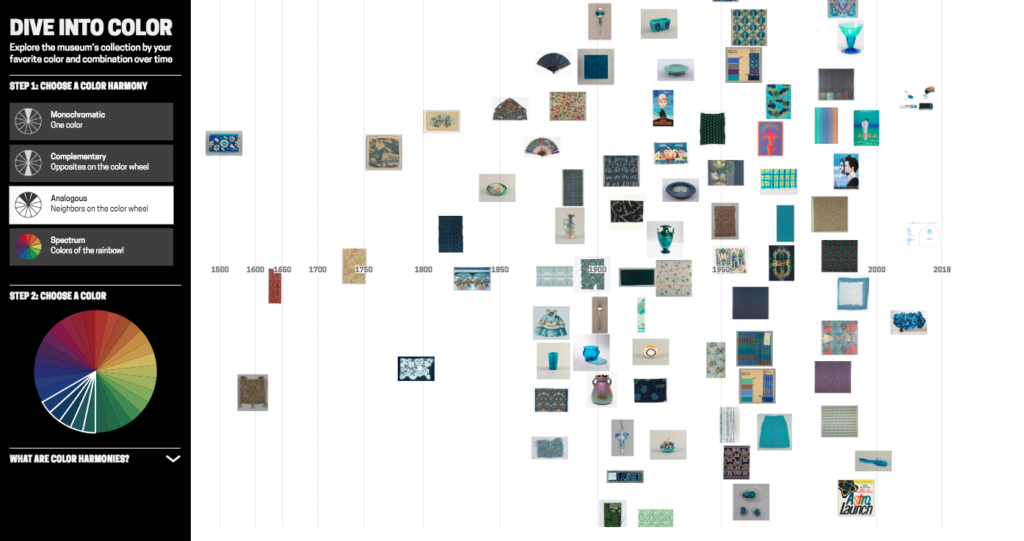
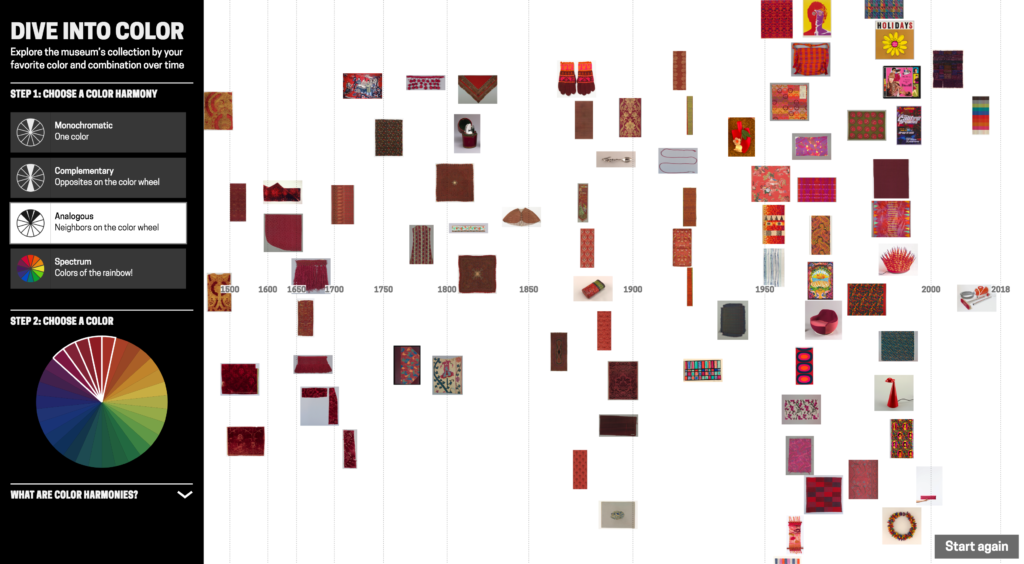
‘Dive into Color’ is an interactive timeline for exploring the Cooper Hewitt collection by colour/colour harmony and time. It is exhibited in ‘Saturated: The Allure and Science of Color’ 11 May 2018 – 13 Jan 2019.

Since spending time at Cooper Hewitt last year on a fellowship, I returned to London where I’m a PhD student at Royal College of Art (RCA) in Innovation Design Engineering supervised by Professor Stephen Boyd Davis. At Cooper Hewitt, I developed a prototype timeline tool for visualising the museum collection by tags.

This post describes further work on that prototype, shifting the tool to exploring the collection by colour. As a curator explained: “[visualising by] colour, I think, is useful for the purposes of the study of the taste for different colours, but it’s also a more interesting exercise for the public just to be able to do and get pleasure out of.” Colour is enjoyable – it’s eye-catching and vibrant – and it offers a visual, intuitive way to explore a digitised collection without needing specialist knowledge. With a design collection like Cooper Hewitt’s, tracing colour through history is also interesting for looking at fashions and innovation in colour technology.

I’ve been asked a few times recently what my process is for designing visualisations. So in this post I’m going to step though the early prototypes and retrace my design decisions. Along the way, I will talk over practical points for working with colour (and colour harmonies!) in collection data, and working between digital and artist colour systems.

Previous colour-collections visualisations
Colour has previously been used both as a facet for search and for visualising collections. Geoff Hinchcliffe’s ‘Tate Explorer’ offers colour as a search facet paired with a timeline. This prototype from the Swedish National Heritage Board (write-up forthcoming) combines colours and tags for exploring a fashion collection. Richard Barrett-Small’s ‘ColourLens’ searches over Rijksmuseum and Walters Art Museum data by colour with a graphic for each item visualising its colour proportions. And Google Arts & Culture’s ‘Art Palette’ is a search engine that finds artworks based on a chosen colour palette.

Collections visualised by colour include the Library of Congress, where Laura Wrubel created this tool for overviewing the colour palettes of objects over a collection and Jer Thorp visualised the colour names present in the titles of works. Also using Cooper Hewitt data, Rubén Abad created this visualisation of the colours present by decade in Cooper Hewitt’s objects. Lev Manovich has visualised artworks, for example Mondrian and Rothko paintings, by colour characteristics including hue and saturation. Everardo Reyes visualised Paul Klee’s paintings by hue. And Brian Foo’s visualisation of the New York Public Library digitised collection has an option to organise items by colour.

I was interested to explore colour alongside the time dimension. And since Cooper Hewitt was preparing for an exhibition, ‘Saturated’, focusing on colour theory and design, I was intrigued to see if I could trace colour harmonies across the collection.

Colour harmonies are combinations of colours that are pleasing to the eye. The relative positions of colours in a colour wheel can be used to describe different harmonies like complementary colours (opposites on the colour wheel), or analogous colours (neighbours on the colour wheel). Artists and designers create different visual effects and contrasts with different harmony types.
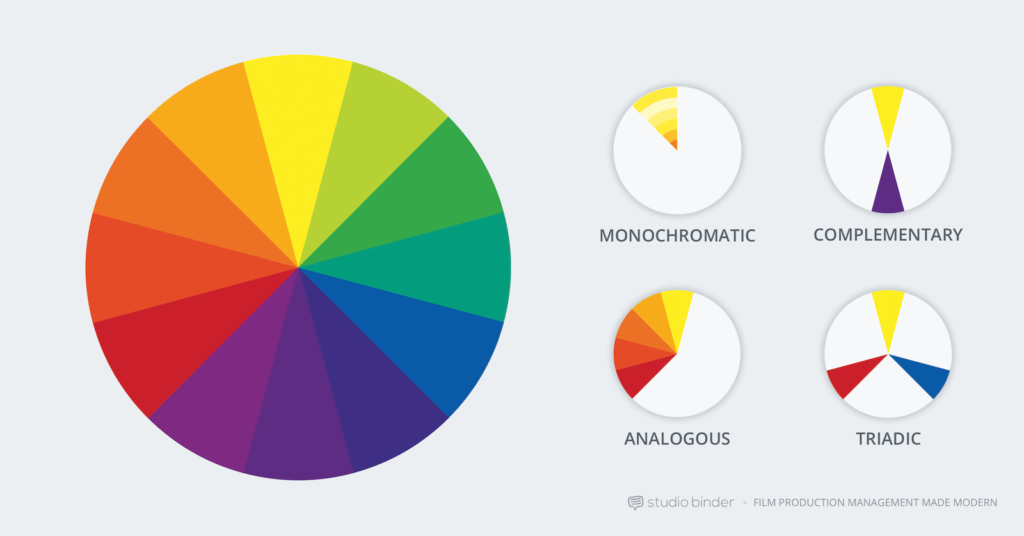
Colour harmony examples, image from studiobinder

Extracting colours across the Cooper Hewitt collection
It’s already possible to search by colour on Cooper Hewitt’s collection site. Colour data was extracted using Giv Parvaneh’s great tool RoyGBiv (described in this Cooper Hewitt Labs post). Roughly, RoyGBiv works by checking the colour value of each pixel in an image, clustering colour values that are similar enough to be considered the same and returning up to 5 dominant colours in an image.

The colours extracted from Cooper Hewitt’s collection with RoyGBiv are good on the whole, but errors sometimes occur. The background colour is sometimes picked up. The effect of light and shadow on a 3D object can introduce multiple, illusory colours:

As always there are quirks working with digitised collections, like these Dutch tiles which had coloured stickers on them when they were photographed:

Or lace photographed against a dark background for contrast:

Since the possible number of unique colours extracted across the collection is huge, searching by colour on the Cooper Hewitt website is simplified by snapping extracted colours to the closest value in a standardised palette (the default is the CSS4 web colour palette, but the CSS3 and Crayola palettes are also options). On the Cooper Hewitt website, you can search the collection by 116 CSS4 colours. Both the original and ‘snapped to’ colour palettes are available in the Cooper Hewitt data – all stored as hex codes (six hexadecimal digits representing the levels of red, green and blue).

Prototyping
As a first step, I adapted my code to visualise collection items matching a CSS4 colour on a timeline (see visualisations below).

Although Cooper Hewitt has an API (an Application Programming Interface: a way for someone to make use of Cooper Hewitt’s data through a set of pre-defined requests made over the web), there is no method for returning all the objects matching a colour. Instead, I used collection data Cooper Hewitt had put on GitHub – an argument for institutions to offer both!

‘Orangered’

‘Steelblue’

‘Olivedrab’

I then started exploring how I might visualise objects featuring a colour harmony, first trying complementary colours (opposites on the colour wheel).

I initially tried to do this by matching a chosen CSS4 colour with the nearest CSS4 colour of opposite hue. The HSL and HSV (hue, saturation, lightness/value) colour systems define hue as an angle round a circle (0-360°), so I inverted hues by converting hex codes to HSL. The visualised results were unsatisfying though, as often the search failed to find any matches. This doesn’t mean to say there was a lack of objects with complementary colours, but that my search was too precise (and artificially precise since which CSS4 palette colours you can consider to be complementary is fuzzy, and the colour data is imprecise anyway e.g. the illusory colours extracted for 3D objects).

I tried extending the reach of my search to matching several colours close to the inverted hue, but it felt very frustrating not to have a visual reference to the range of colours in a region and what colours were being searched over.

So I started experimenting with using a colour wheel input as a way to pick colour combinations and simultaneously see possible hue relations. I first tried mapping the colours from the standardised palettes by HSL round a circle.
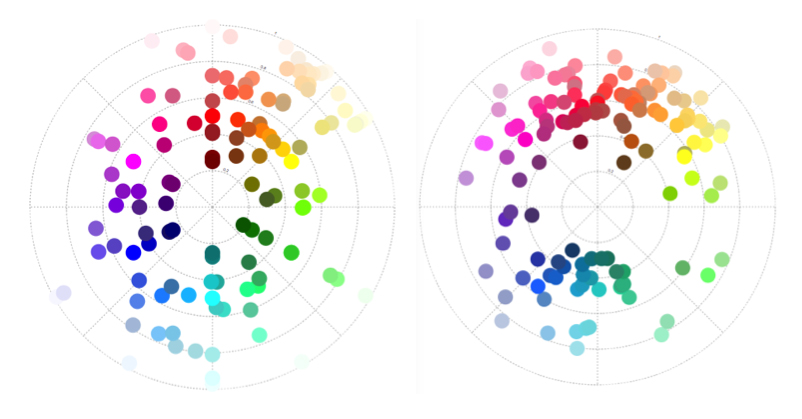
‘Snapped to’ colours in the Cooper Hewitt collection. CSS4 (left) and Crayola (right) palettes mapped by hue (in HSL). Angle = hue, radius = lightness.

And to make it easier to see the possible colours, I wrote some code to map the CSS4 palette colours to a wheel.

CSS4 palette colours → mapped round a wheel. Hue (HSL) = angle, ordered by lightness

I realised at this point, though, that the resulting design doesn’t match a typical artist’s/pigment colour wheel (which has red, yellow, blue – RYB – primary colours). HSL is a simple transformation of RGB colour space, and therefore the wheel has red, green, blue primaries. If this colour wheel is used to search over design artefacts, surely it would be more appropriate to use a design closer to the norm for artists and designers? (These in-depth articles by David Briggs – part 1, part 2 – explain the differences between traditional and modern colour theory, and colour training for artists).

There is no ‘correct’ colour wheel to adopt, but converting my HSL colour wheel to something closer to an artist’s version (using code from Ben Knight’s implementation of Adobe’s ‘Kuler’ colour wheel) felt like a reasonable compromise here.

(Left) Colours mapped by hue (HSL). Angle = hue, radius = lightness. (Right) Colour mapping adjusted to more closely resemble an artist’s colour wheel.

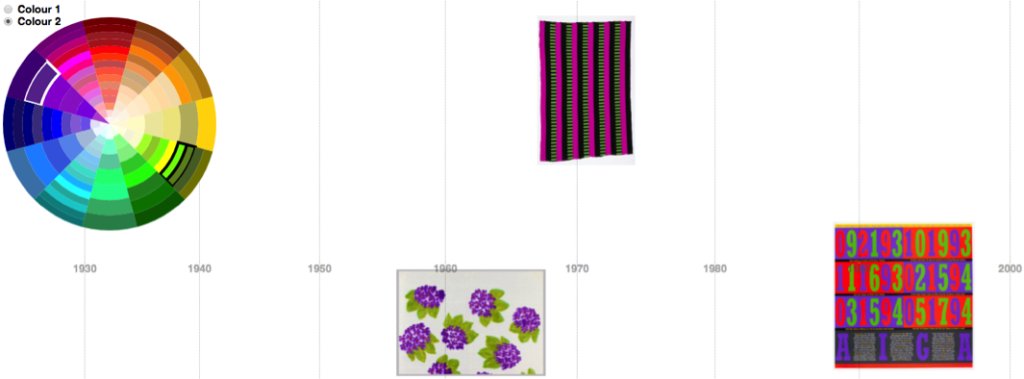
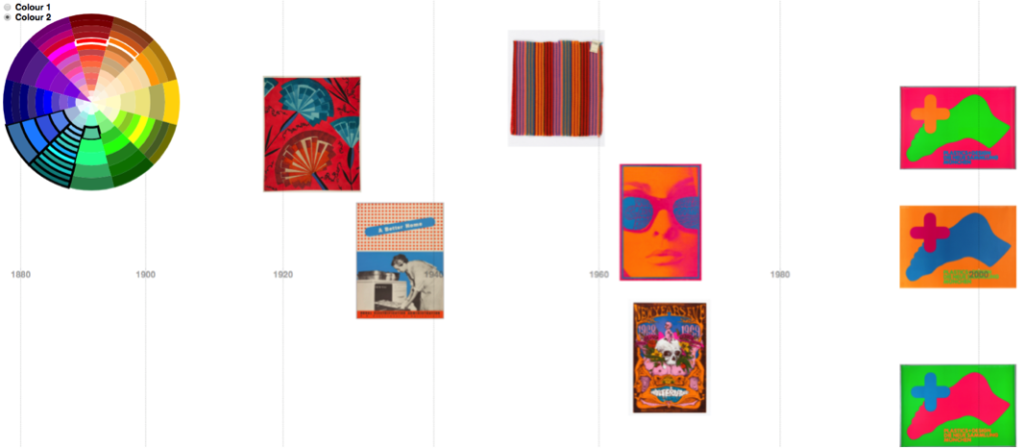
Using this colour wheel as a guide and an input, I could see and choose which colours to query. By searching over multiple colours, the visualised results were better. (In the images below, white and black borders around tiles in the colour wheel indicate the searched-over colour combinations):

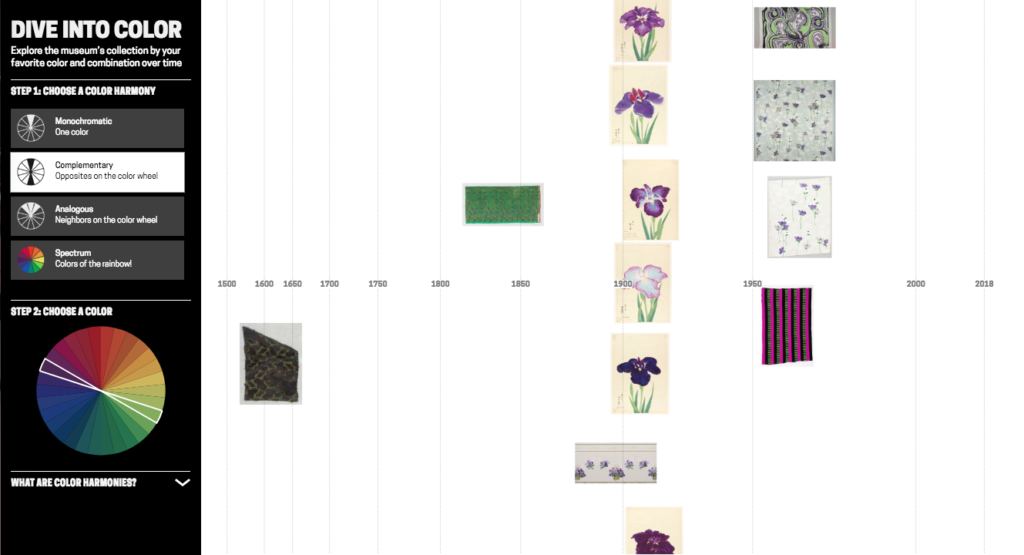
Purple against olive timeline

Orangered against cyan/blue timeline

Querying against colour data in HSV
While the results looked better with this prototype, the user interface is a mess and complicated to use. And the search query was not excluding objects that featured other colours in addition to the searched colour combination.

Sticking with the CSS4 palette was greatly complicating the task, so I abandoned using it. I converted all the original extracted colours (not ‘snapped’) from hex codes to HSV and created my own Elasticsearch index with the HSV colours stored as a nested datatype. This way I can: search over a hue range, with a threshold on saturation and value; exclude objects also featuring other hues; and it is simple to define more complex colour harmony searches (e.g. analogous, triadic, quadratic and split complementary).

Different colour harmonies tried in prototyping

Colour wheel graphic for objects
As a by-product, I realised I could repurpose my code to map individual object palettes round a colour wheel too. Thus, you get a compact graphic describing the colour relationships present in a single design. This is a nice example of the serendipity of designing, where you identify new possibilities as a result of seeing what you have already made.


(Above) Object with colour palette, (below) palette mapped to a wheel: easy to see complementary harmony


Colour wheel graphic examples

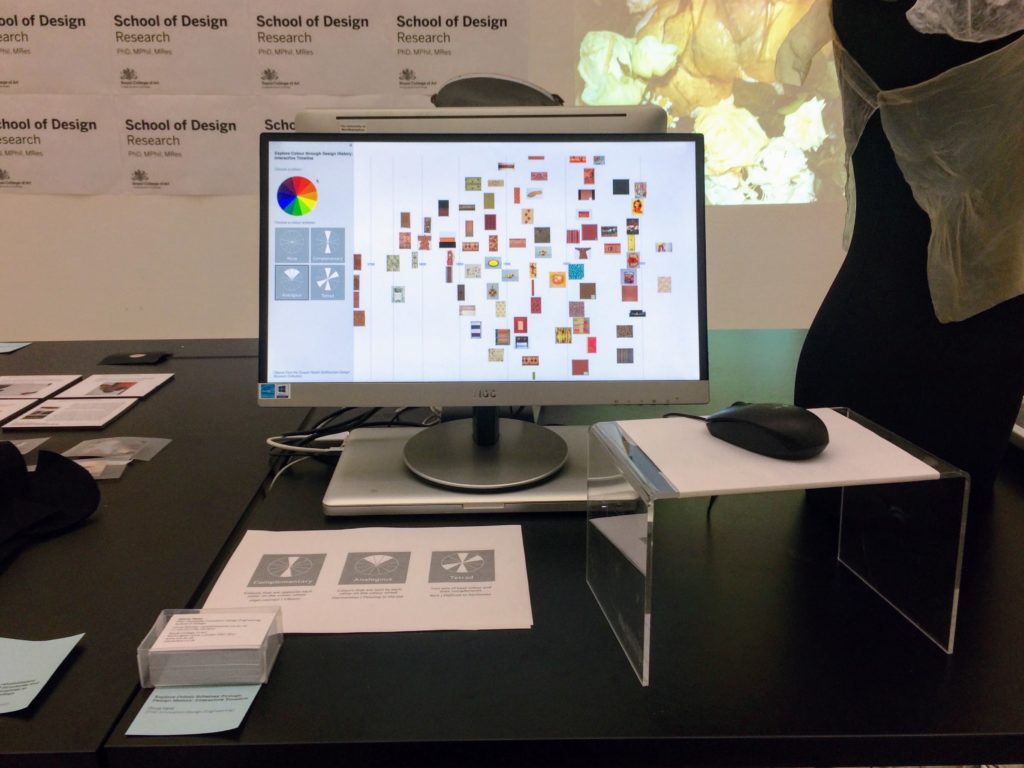
I adapted a simple artist’s (RYB) colour wheel to use as an input and tested the prototype with visitors at Royal College of Art’s January 2018 ‘Work in Progress’ show.

Testing the prototype with visitors at Royal College of Art’s Jan 2018 ‘Work in Progress’ show

In order to avoid reducing the size of the images (so it’s still possible to see what the objects are), I’ve capped the number of visualised objects to the 100 most saturated in colour.

There were few hits for the more complex harmonies (quadratic, tetradic, split complementary) and the results felt less convincing. I had widened the hue range to search over in order to increase the small number of hits, so the results were less visually cohesive anyway. And, in conversations with the museum curators, we decided to drop these more complex harmonies from the interface.

As mentioned earlier, there are some errors in the colour data. At this stage, since this setup only allows a fixed set of possible searches, with repeatable results, it was worth it for me to do some manual editing of the colour data to remove obvious errors.

Final interface design
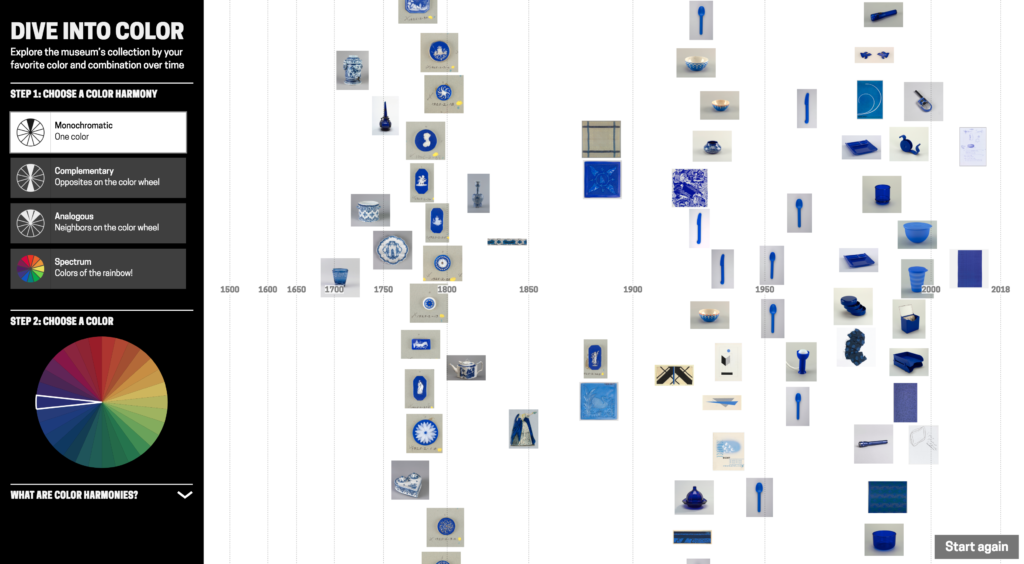
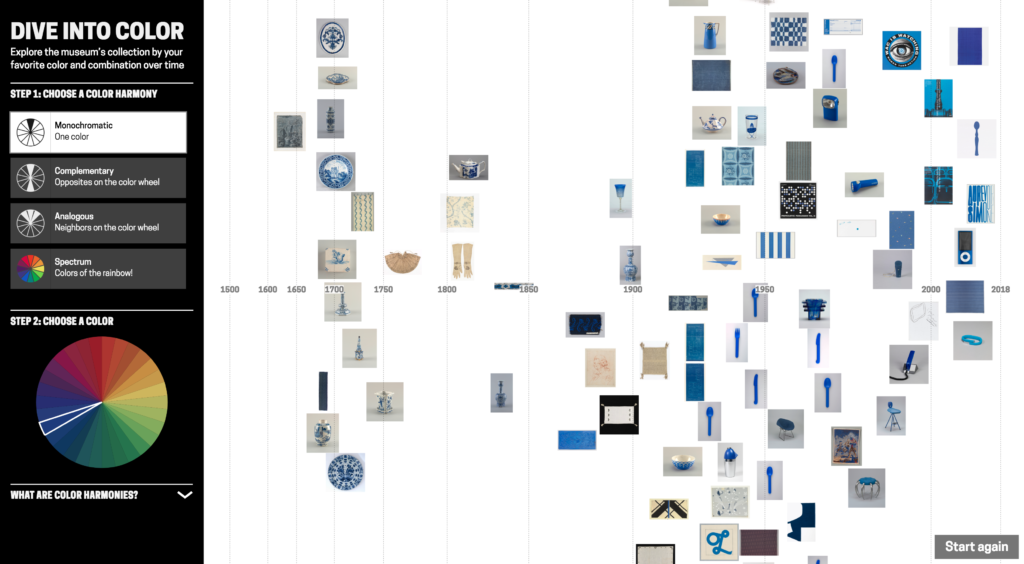
For the final (more polished!) interface design, which is now on display, I set on adopting a colour wheel input inspired by this Hilaire Hiler design in Cooper Hewitt’s collection. (This wheel actually has 4 ‘psychological’ colour primaries and features 30 hues). The interface has 4 harmony options: monochromatic, complementary, analogous and spectrum (a rainbow colour option).

Color wheel picker, inspired by Hiler’s design, used in ‘Dive into Color’


‘Dive into Color’ installed at Cooper Hewitt. Photo credit: Caroline Koh Smith

‘Dive into Color’ installed at Cooper Hewitt. Photo credit: Caroline Koh Smith

What does the tool reveal?
Visualising the Cooper Hewitt data this way gives some sense of when colours appear in time. There are no results for purple pre-19th century. Perhaps because of the difficulty and expense of producing purple before synthetic dyes/pigments were developed in the 19th century?

Though, as often is the case interpreting collection visualisations, it is difficult to disentangle historical trends from the biases and character of what has been collected and how it has been catalogued. (And bear in mind I’m only visualising the 100 objects most saturated in colour for a search). For example, these green and purple Japanese prints of irises are clearly part of a set rather than indicating some colour trend around 1910. Using the images themselves as data points is helpful for diagnosing this.

The same purple-green visualisation demonstrates how the tool can connect artefacts across time, in this case with by similar colour scheme/design:

   
(Left) Frieze (USA), 1890–1910; Manufactured by Hobbs, Benton & Heath, (right) Sidewall, Anemone, 1960–66; Designed by Phoebe Hyde 

The tool surfaces colours, used in a particular material, that are strongly attached to design types. For example these English vivid blue and white late-18th century ceramic buttons/medallions:


(From left) Medallion (England), late 18th century, stoneware; Medallion (England), late 18th century, stoneware; Button (England), late 18th century; stoneware

Blue and white ceramics manufactured in the Netherlands in the late-17th century, early-18th century:

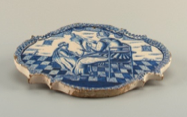
  
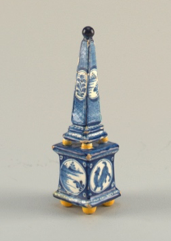
(From left) Plate (Netherlands), 1675–1725, tin-glazed earthenware; Plaque (Netherlands), 1675–1725, tin-glazed earthenware; Obelisk (Netherlands), ca. 1700–25, tin-glazed earthenware

And French red and white textiles in the late 18th/ early 19th century:


(From left) Textile (France), late 18th century, cotton; Textile (France), ca. 1850, cotton; Textile (France), 18th century, cotton

Visualising blue-yellow shows more saturated colour from mid-19th century onwards. Is this signalling changing fashion, or the availability of new synthetic dyes/pigments? Can we connect the more saturated harmony in designs from the mid-1800s with Chevreul’s influential text from the time ‘The Law of Simultaneous Colour Contrast’, describing how colour harmony can be used to create a more vibrant effect? Though a number of the earlier objects are textiles and the colours will have faded over time. Possibly a combination of these factors is at play here.

User evaluations
While I’ve discussed historical trends and the Cooper Hewitt collection, I’m also interested in how others might use a tool like this in their own projects, and with other collections. I conducted a number of interviews around this tool design with history of design students and colour history specialists, exploring their impressions of it and if/how they might use it in their own work. (I was also interested to talk with designers about using a tool like this for design inspiration, but struggled with recruiting!)

The history of design students (Masters students in History of Design from the Royal College of Art/Victoria & Albert Museum programme) discussed examples from their own work where such a tool could be useful. Example projects included: tracing the use of blue through time in anti-vaccination movement posters to convey trust; or pink clothing in the history of women’s protest movements. In both these examples a hue, rather than a more specific colour, was of interest. Out of these conversations, the most useful features to add would be a filter by object type, and to be able to narrow down a time period.

For the specialist colour audience, though, this tool design has some issues. Not least because I do not know how accurately the photos represent the true colours of the objects (what lighting conditions the photographs were taken in, if they have been retouched etc.). While the overall extracted colours seem generally good, they may not be precise enough for some. The control in searching by colour – only by hue – may also be too limited for some needs.

Seeing is believing?
Colour data is computationally extracted, in contrast with manually added metadata. Do these different cases require different considerations for designing visualisations?

In this post, I’ve used arguments like it ‘looked better’, or the results were ‘more satisfying’ to explain my design decision-making. Working with colour data I knew had errors, I was more comfortable adjusting parameters in my search queries and editing obviously wrong colour data to return what looked ‘better’ to me. For colour, you can immediately see when images appear in the visualisation don’t match. (Though, of course, looking at the visualised results will not tell you if there are absent items). In interviews, I asked whether this data massaging to produce more satisfying results bothered interviewees and was often told the person didn’t mind, but they’d worry if there were obvious errors appearing in the visualisation.

While prototyping the design in conversation with curators at Cooper Hewitt, we discussed the possibility of different versions of this tool: offering more control in search and not massaging parameters for in-depth researchers. But there is also value in visually satisfying results. As a curator expressed it: “We have a large number of professional designers and design students who come here … Just seeing beautiful examples of how people have used particular colour schemes is research. So the visually satisfying… seeing the most compelling works has a value as well. For the professional designers who, say ‘wow this is really incredible use of this colour scheme. I want to share this with my students.’

‘Dive into Color’ has since been exhibited in the London Design Festival 2018, and will hopefully go online at some point. Any feedback is very welcome: olivia.fletcher-vane@network.rca.ac.uk

Many thanks to Cooper Hewitt for their help with this project: especially Pamela Horn, Jennifer Cohlman Bracchi, Susan Brown and the technical team for getting ‘Dive into Color’ up and running in the galleries. Thanks to Neil Parkinson who showed me the Colour Reference Library at RCA, to Dr Alexandra Loske, Patrick Baty and RCA students for their thoughts, and to Jonny Jiang for help with the final UI design. And thanks to Stephen Boyd Davis for his continued help and support!

 

New Relationships: A Summer at Cooper Hewitt

This summer I was the Peter A. Kruger Cross-Platform Publishing intern. When asked about my responsibilities many people want to know, “What does “Cross-Platform” mean?”

At Cooper Hewitt, Cross-Platform Publishing sits at the nexus of the Digital and Emerging Media, Communications, Curatorial, Education, and Exhibitions departments. During my internship I have helped to research, develop, and manage all forms of content for print and electronic publications. As a part of the Cross-Platform Publications team, I have had the opportunity to participate in decision-making that affects the design and content of museum channels, printed books, and digital tables.

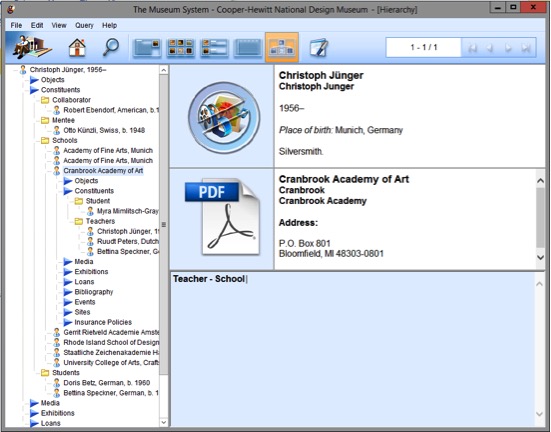
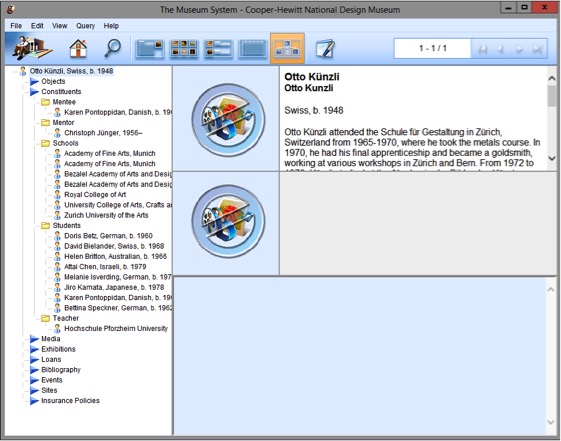
One of my favorite projects this summer was collaborating with the Product Design and Decorative Arts department to develop their plan for the digital tables in the museum’s upcoming exhibition, Jewelry of Ideas: Gifts from the Susan Grant Lewin Collection. The process for developing an application appearing on one of the museum’s digital tables in an exhibition begins with thinking about what stories are not being told in the exhibition didactics. When Cooper Hewitt launched its digital tables in 2014 the team built an application that shows relationships between the founding donors of the Cooper Hewitt collection. It has been in use in the exhibition Hewitt Sisters Collect. So I was asked how might we modify that application to apply to the constituents in the Jewelry of Ideas exhibition. I began looking at research about the designers in the exhibition to uncover meaningful relationships and connections between designers. Working with the curator, we decided which relationships we believed were the most important to highlight. From there, I along with the help of our registrar created relationship hierarchies in TMS. For the Susan Grant Lewin exhibition we decided that the most important relationships to feature on the digital table were those created by the schools that various designers attended or taught for. With this information we hope visitors can see how various styles and techniques arose from certain schools and how these designers’ works influenced one another.

To build the foundation of the interactive content in TMS, I recorded the connections between designers based on school, mentorship, and history of collaboration. Currently, new code is being written to modify the donor application. Once completed the collecetion site records and the digital table will reveal the relationships to its users. The table interface is designed with a “river” where objects and designer images will flow on the digital table. When a designer is selected, a short biography will appear. Underneath the biography, related designers are listed who either participated in the same school or worked together in some way. We hope that this interactive digital experience will help visitors visualize the interconnected nature of the collection in a new way.


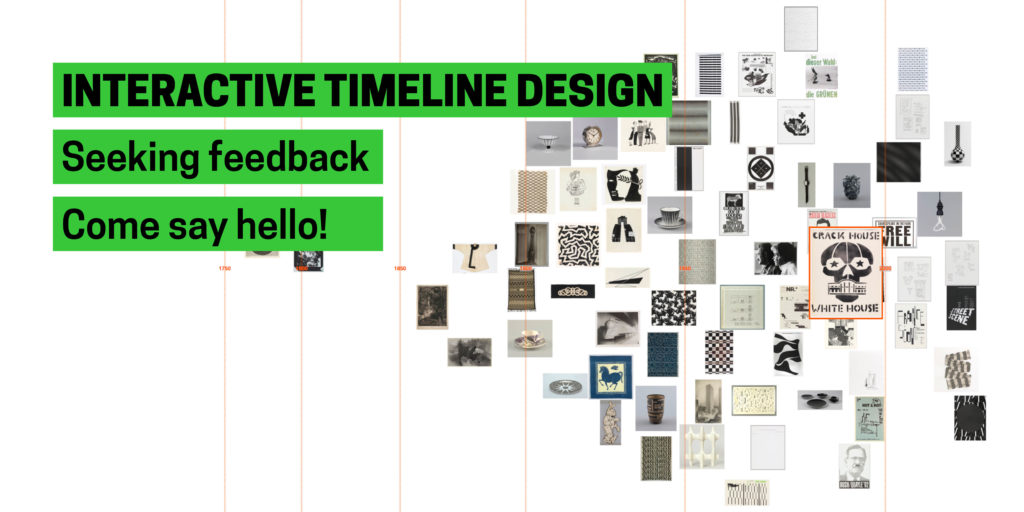
Interactive timeline design: seeking feedback!
Guest post by Olivia Vane

I’ve been visiting Cooper Hewitt for the last few months designing a new way of exploring the collection using timelines and tags. (For more background and details of the project, I’ve written a post here).

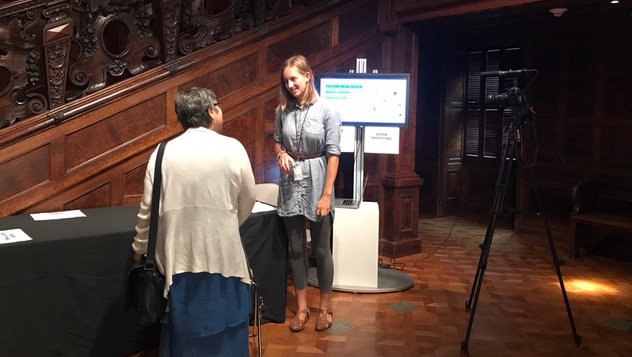
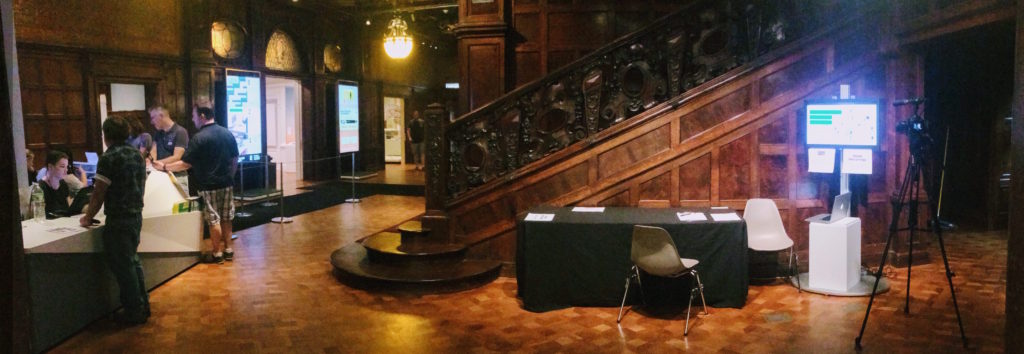
I’m set up with a prototype on a touchscreen in the Cooper Hewitt galleries today seeking impressions and feedback from visitors. Do drop in and have a play! I would love to hear your thoughts.


Parting gifts

Today is my last day at Cooper Hewitt, Smithsonian Design Museum. It’s been an incredible seven years. You can read all about my departure over on my personal blog if you are interested. I’ve got some exciting things on the horizon, so would love it if you’d follow me!

Parting gifts

Before I leave, I have been working on a couple last “parting gifts” which I’d like to talk a little about here. The first one is a new feature on our Collections website, which I’ve been working on in the margins with former Labs member, Aaron Straup Cope. He did most of the work, and has written extensively on the topic. I was mainly the facilitator in this story.

Zoomable Object Images

The feature, which I am calling “Zoomable Object Images” is live now and lets you zoom in on any object in our collection with a handy interface. Just go to any object page and add “/zoom” to the URL to try it out. It’s very much an experiment/prototype at this point, so things may not work as expected, and not ALL objects will work, but for the majority that do, I think it’s pretty darn cool!

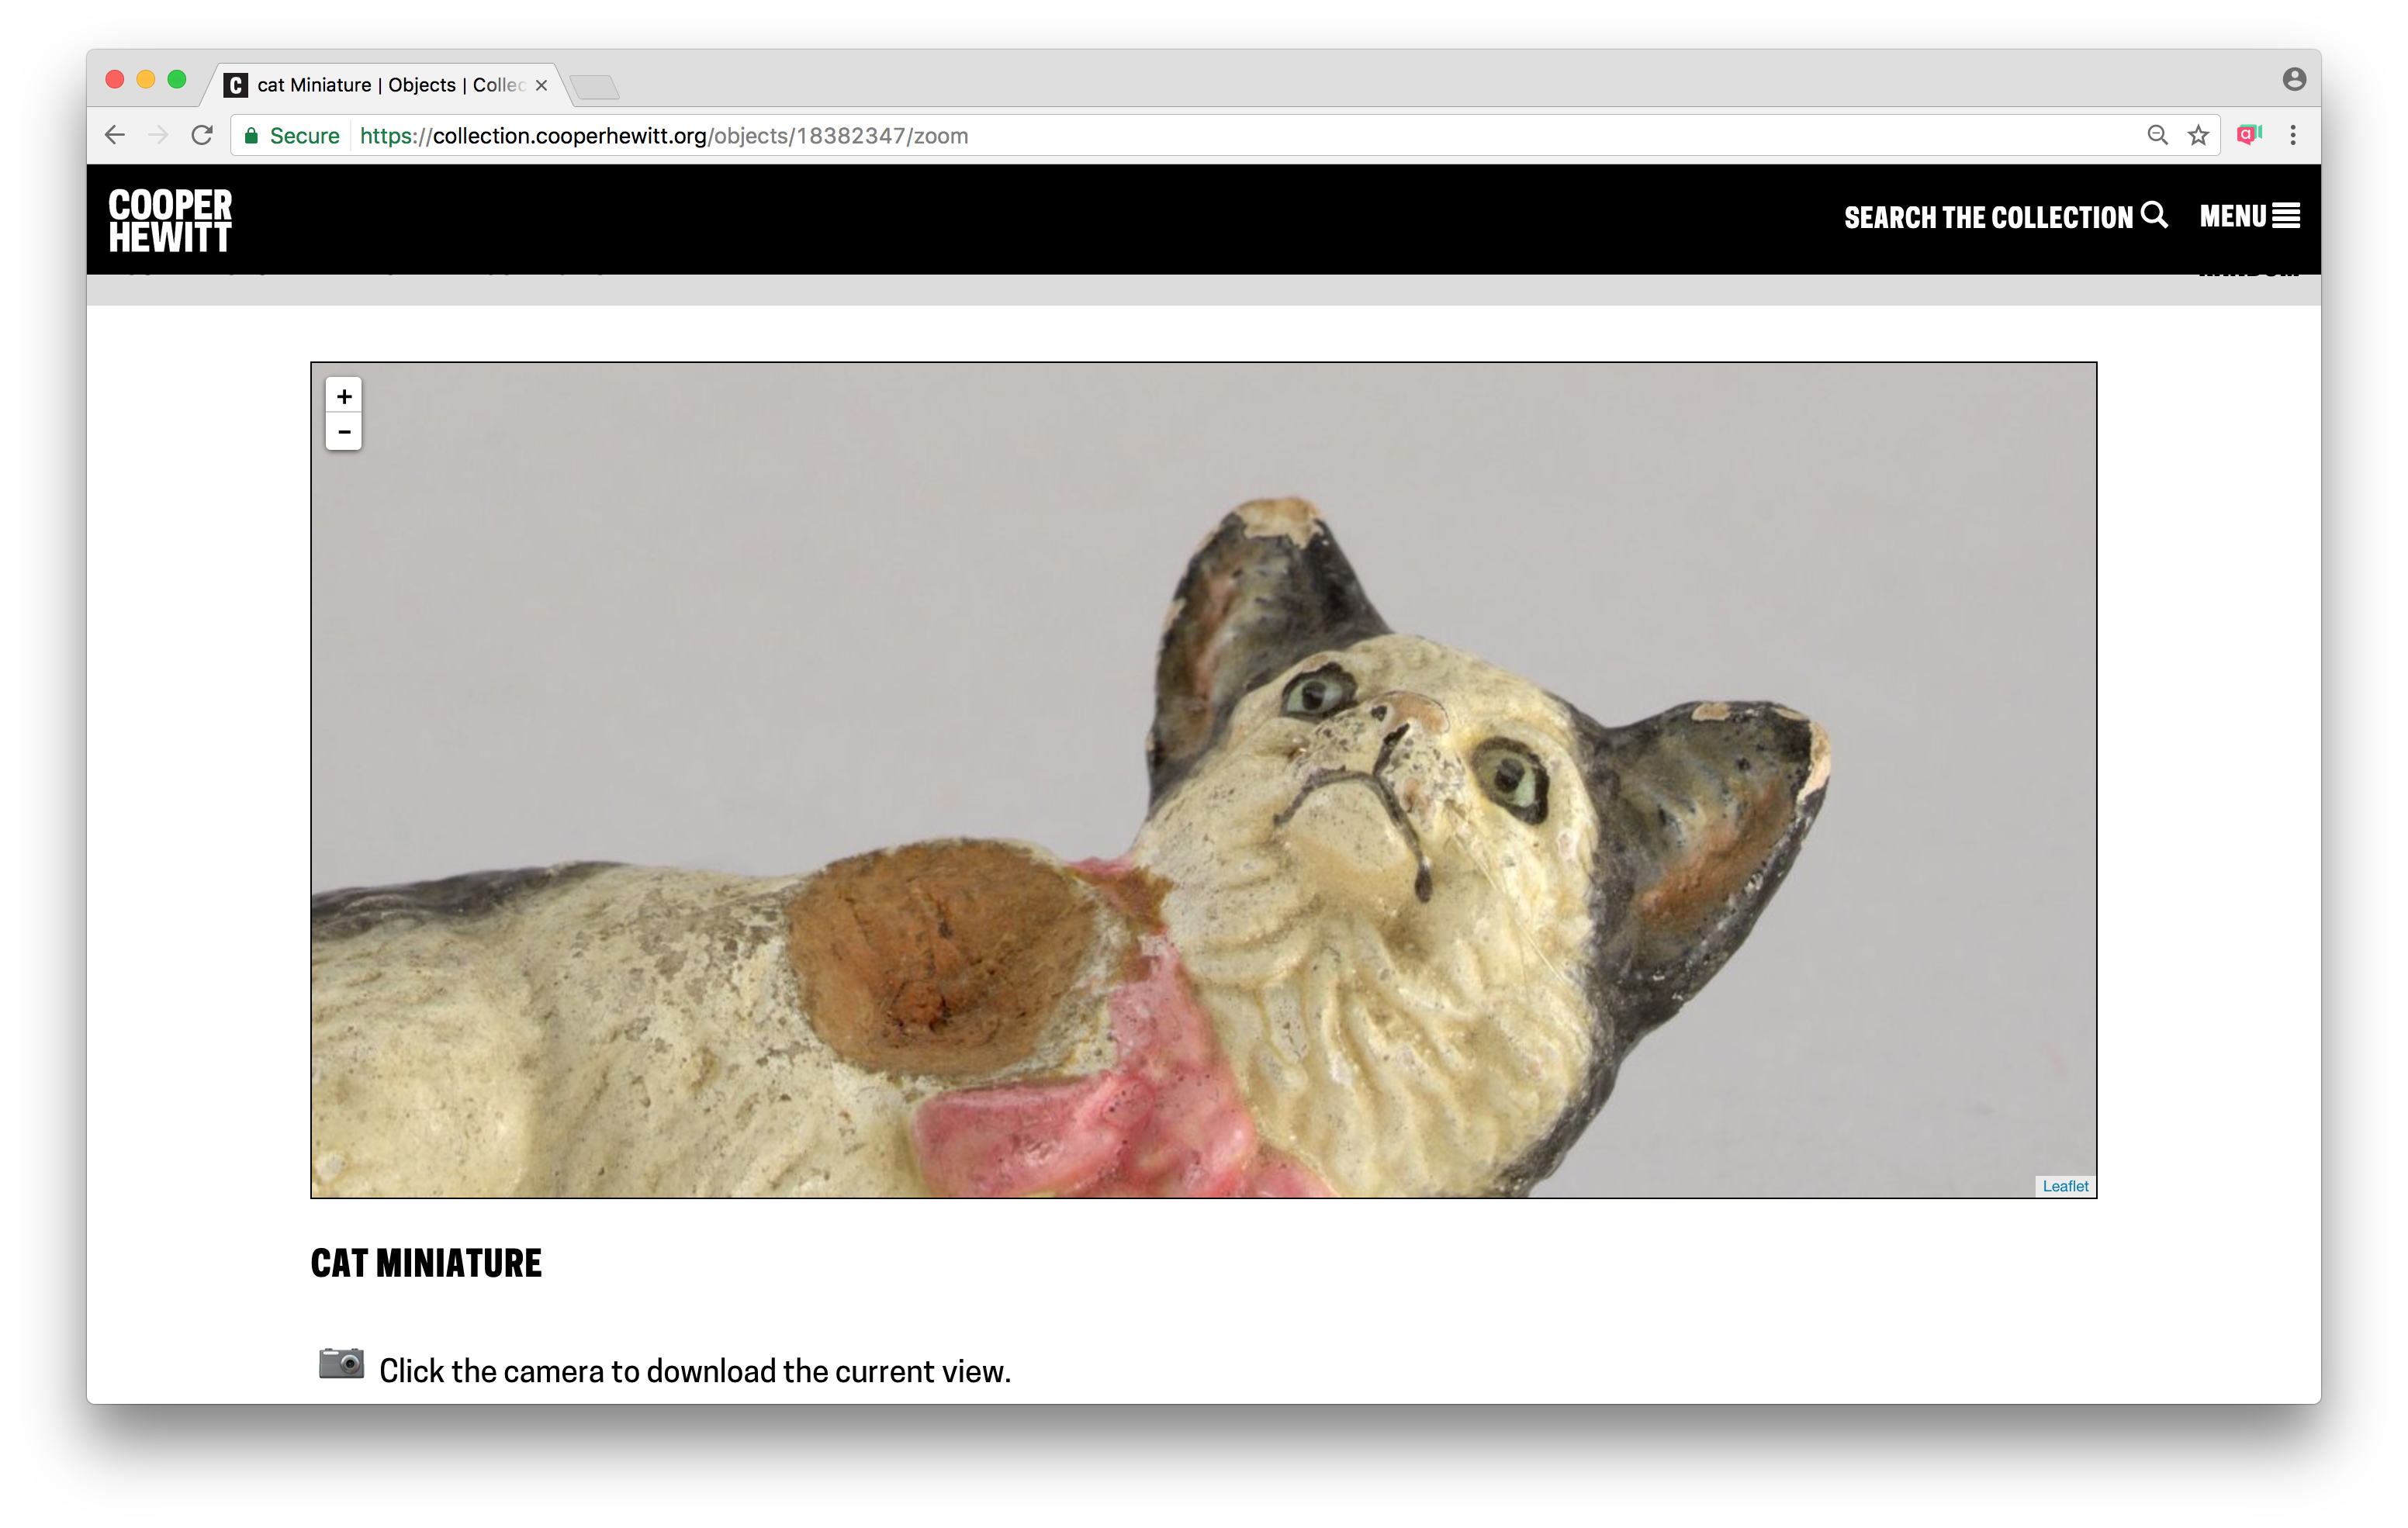
Here’s an example, zoomed all the way in – https://collection.cooperhewitt.org/objects/18382347/zoom

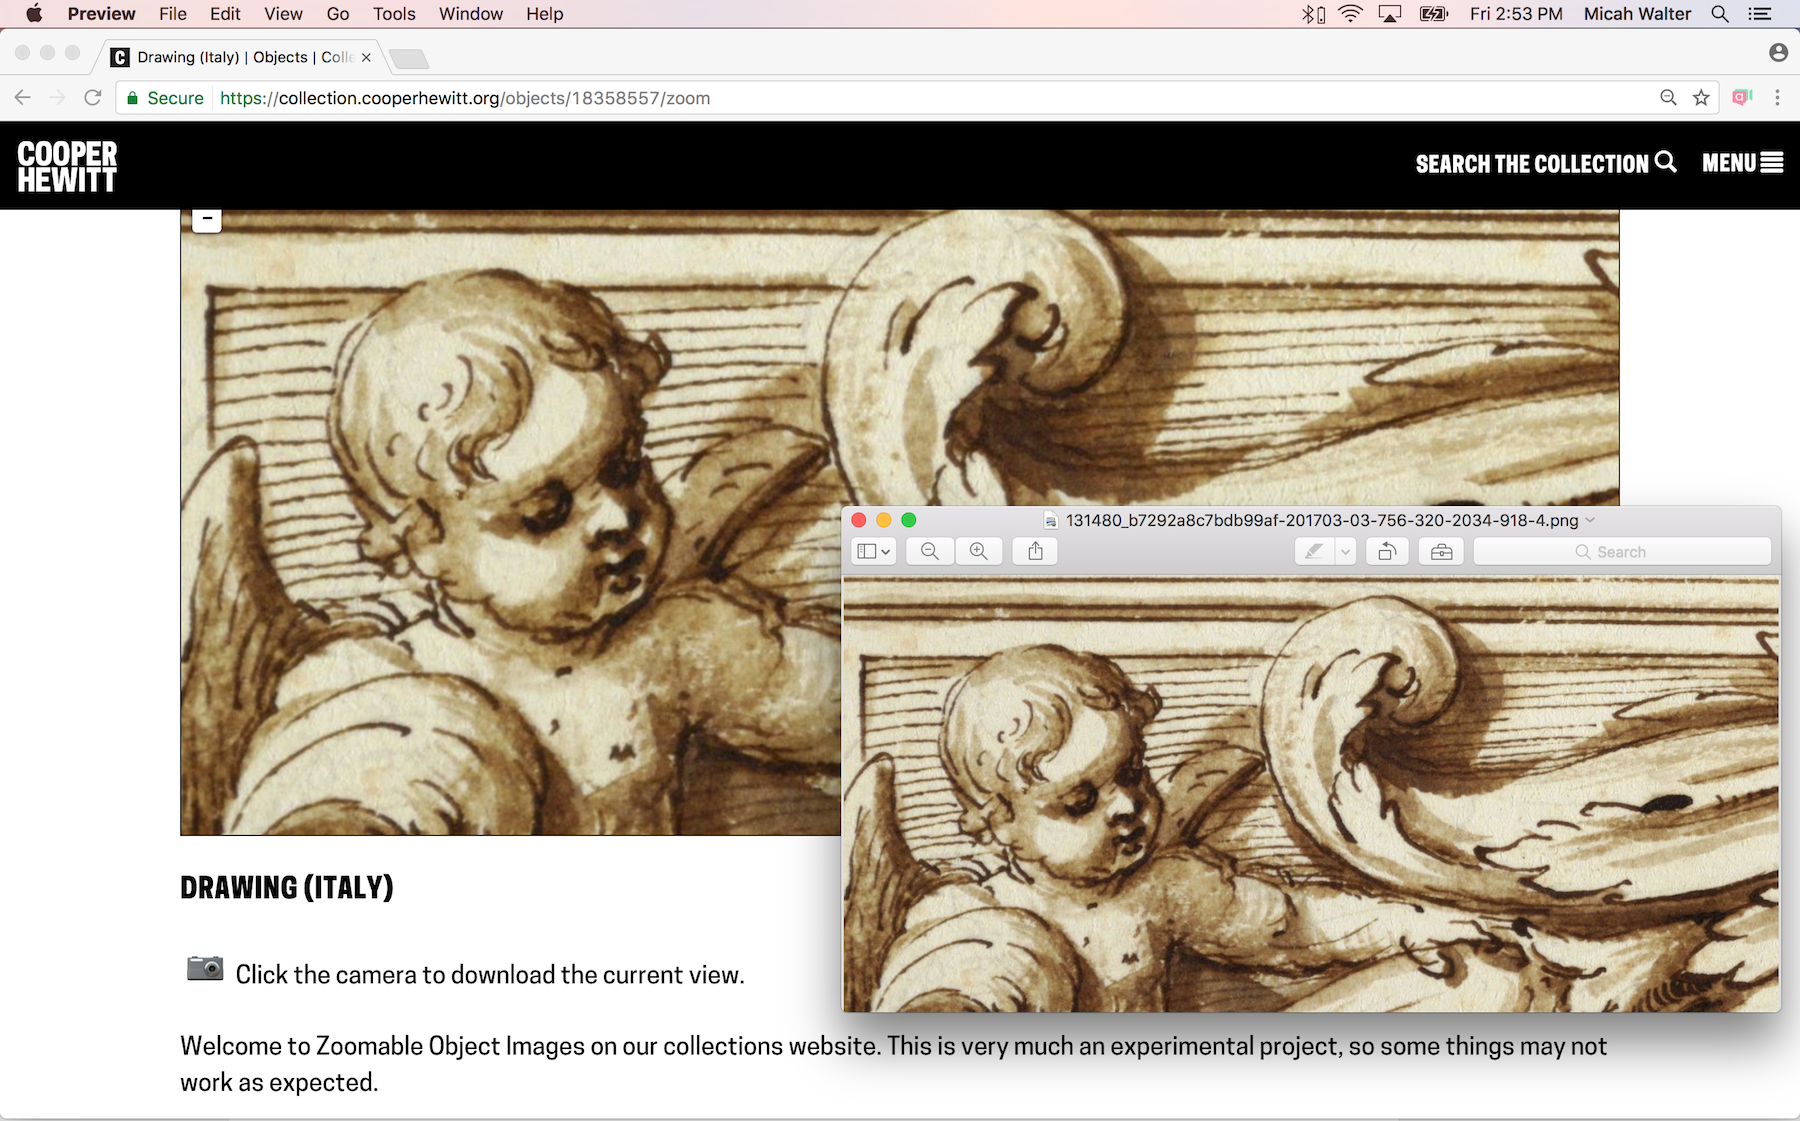
Notice that there is also a handy camera button that lets you grab a snapshot of whatever you have currently showing in the window!

Click on the camera to download a snapshot of the view!

This project started out as a fork of some code developed around the relatively new IIIF standard that seems to be making some waves within the cultural sector. So, it’s not perfectly compliant with the standard at the moment ( Aaron says “there are capabilities in the info.json files that don’t actually exist, because static files”), but we think it’s close enough.

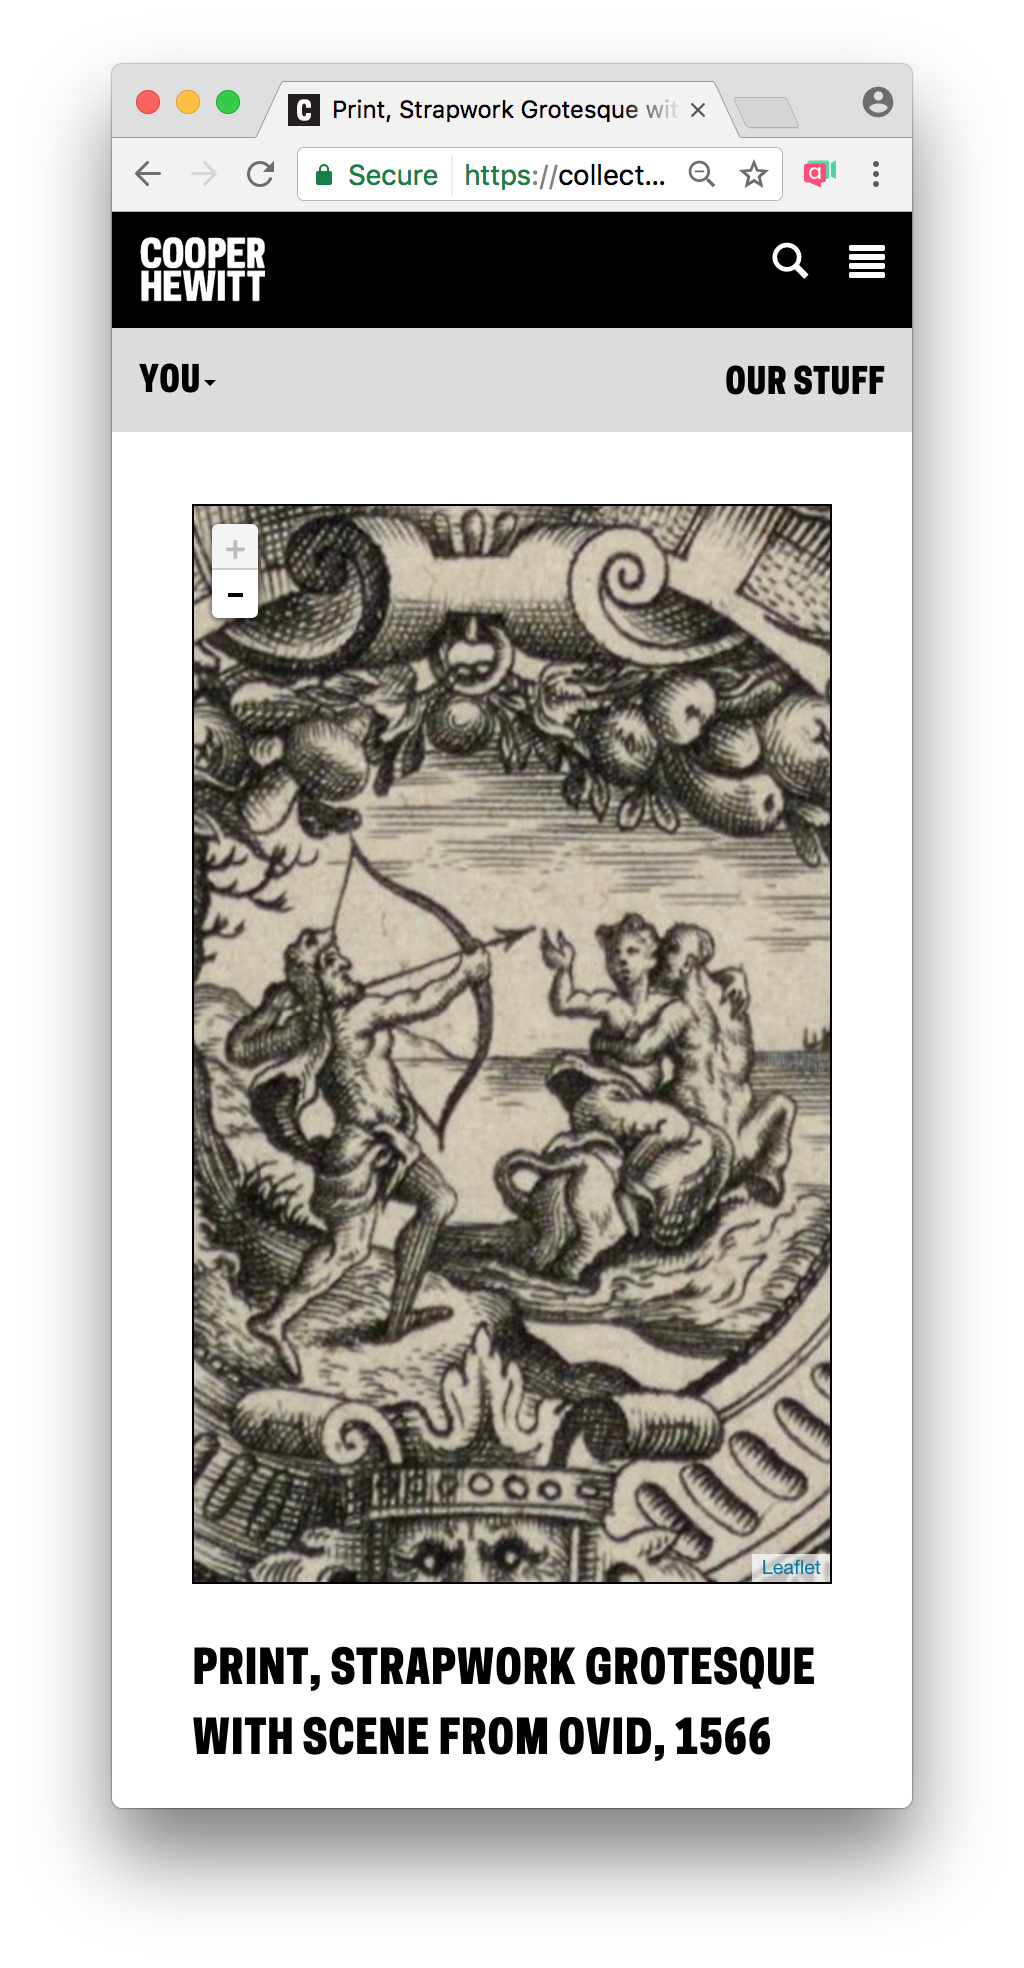
You can’t tell form this image, but you can pinch and zoom this on your mobile device.

To do the job of creating zoomable image tiles for over 200,000 object we needed a few things. First, we built a very large EC2 server. We tried a few instance sizes and eventually landed on an m4.2xlarge which seemed to have enough CPU and RAM to get the job done. I also added a terabyte of storage to the instance so we’d have enough room to store all the images as we processed them.

Aaron wrote the code to download all of our high res image files and process them into tiles. The code is designed to run with multiple threads so we can get the most efficiency out of our big-giant-ec2 server as possible (otherwise we’d be waiting all year for the results). We found out after a few attempts that there was one major flaw in the whole operation. As we started to generate thousands and thousands of small files, we also started to run up to the limit of inodes available to us on our boot drive. I don’t know if we ever really figure this out, but it seemed to be that the OS was trying to index all those tiny files in some way that was causing the extra overhead. There is likely a very simple way to turn that off, but in the interest of getting the job done we decided to take an alternative route.

Instead of processing and saving the images locally and then transferring them all to our S3 storage bucket, Aaron rewrote the code so that it would upload the files as they were processed. S3 would be their final resting place in any case, so they needed to get there one way or another and this meant that we wouldn’t need so much storage during processing. We let the script run and after a few weeks or so, we had all our tiles, neatly organized and ready to go on S3.

Last but not least, Aaron wrote some code that allowed me to plug it into our collections website, resulting in the /zoom pages that are now available. Woosh!

Check out the code here https://github.com/thisisaaronland/go-iiif – and dive into the tl;dr discussion over here if you’re into this kinda thing.

Cooper Hewitt in a box

The second little gift is around some work I’ve been doing to try and make developing and maintaining code at Cooper Hewitt a tiny bit better.

Since we started all this work we’ve been utilizing a server that sits on the third-floor (right next to Josue) called, affectionately, “Bill.” Bill (pictured above) has been our development machine for many years, and has also served as the server in charge of extracting all of our collection data and images from TMS and getting them published to the web. Bill is a pretty important piece of equipment.

The pros to doing things this way are pretty clear. We always have, at the ready, a clone of our entire technology stack available to use for development. All a developer needs to do is log in to Bill and get coding. Being within the Smithsonian network also means we get built in security, so we don’t need to think about putting passwords in place or trying to hide in plain site.

The cons are many.

For one, you need to be aware of each other. If more than one developer is working on the same file at the same time, bad things can happen. Sam sort of fixed this by creating individual user instances of the major web applications, but that requires a good bit of work each time you set up a new developer. Also, you are pretty much forced to use either Emacs or Vi. We’ve all grown to love Emacs over time, but it’s a pain if you’ve never used it before as it requires a good deal of muscle memory. Finally, you have to be sitting pretty close to Bill. You at least need to be on the internal network to access it easily, so remote work is not really possible.

To deal with all of this and make our development environment a little more developer friendly, I spent some time building a Vagrant machine to essentially clone Bill and make it portable.

Vagrant is a popular system amongst developers since it can easily replicate just about any production environment, and allows you to work locally on your MacBook from your favorite coffee shop. Usually, Vagrant is setup on a project by project basis, but since our tech stack has grown in complexity beyond a single project ( I’ve had to chew on lots of server diagrams over the years ), I chose to build more of a “workspace.”

I got the idea from Dan Phiffer at Mapzen who did the same for their Who’s on First project.

Essentially, there is a simple Vagrantfile that builds the machine to match our production server type, and then there is a setup.sh script that does the work of installing everything. Within each project repository there is also a /vagrant/setup.sh script that installs the correct components, customized a little for ease of use within a Vagrant instance. There is also a folder in each repo called /data with tools that are designed to fetch the most recent data-snapshots from each application so you can have a very recent clone of what’s in production. To make this as seamless as possible, I’ve also added nightly scripts to create “latest” snapshots of each database in a place where they Vagrant tools can easily download them.

This is all starting to sound very nerdy, so I’ll just sum it up by saying that now anyone who winds up working on Cooper Hewitt’s tech stack will have a pretty simple way to get started quickly, will be able to use their favorite code editor, and will be able to do so from just about anywhere. Woosh!

Lastly

Lastly, it’s been an incredible journey working here at Cooper Hewitt and being part of the “Labs.” We’ve done some amazing work and have tried to talk about it here as openly as possible–I hope that continues after I’m gone. Everyone who has been a part of the Labs in one way or another has meant a great deal to me. It’s a really exciting place to be.

There is a ton more work to do here at Cooper Hewitt Labs, and I am really excited to continue to watch this space and see what unfolds. You should too!

Thanks for everything.

-micah

Process Lab: Citizen Designer Digital Interactive, Design Case Study

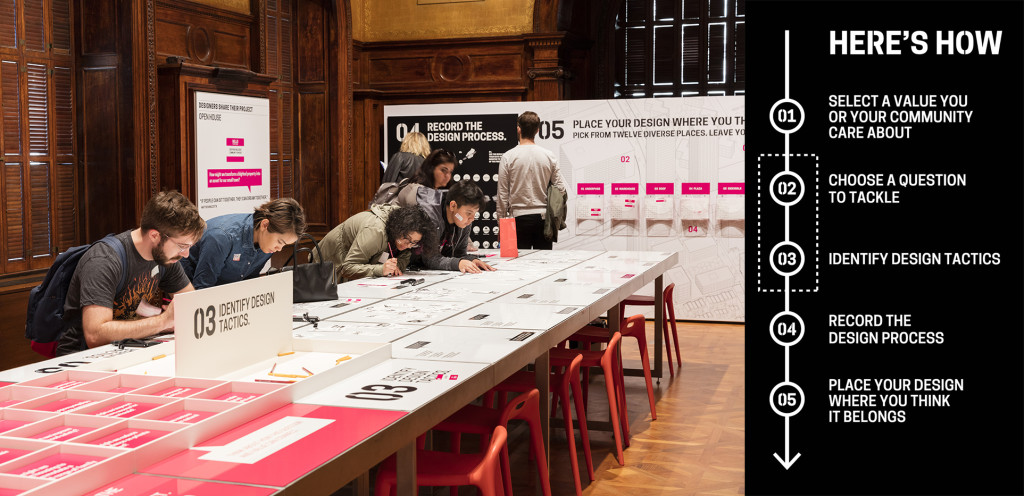
Fig.1. Process Lab: Citizen Designer exhibition and signage, on view at Cooper Hewitt.

Fig.1. Process Lab: Citizen Designer exhibition and signage, on view at Cooper Hewitt

Background

The Process Lab is a hands-on educational space where visitors are invited to get involved in design process. Process Lab: Citizen Designer complimented the exhibition By the People: Designing a Better America, exploring the poverty, income inequality, stagnating wages, rising housing costs, limited public transport, and diminishing social mobility facing America today.

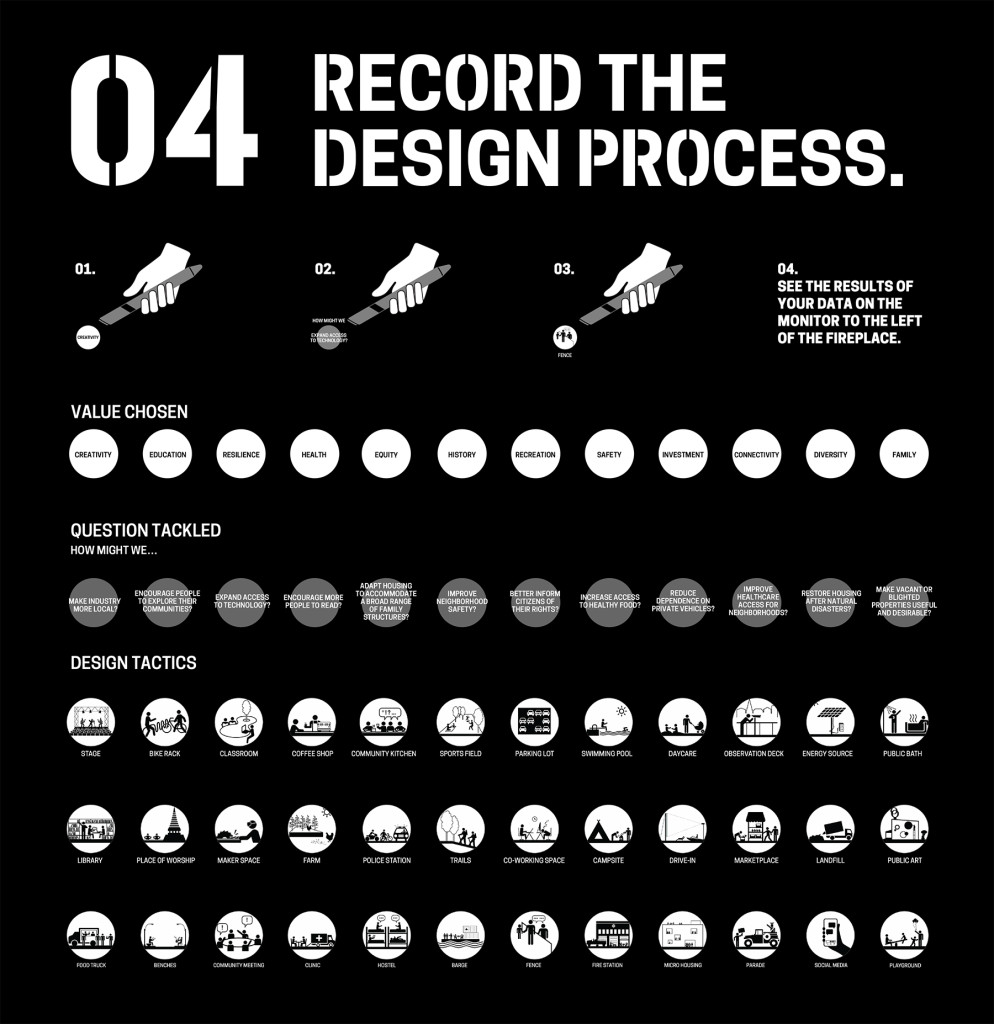
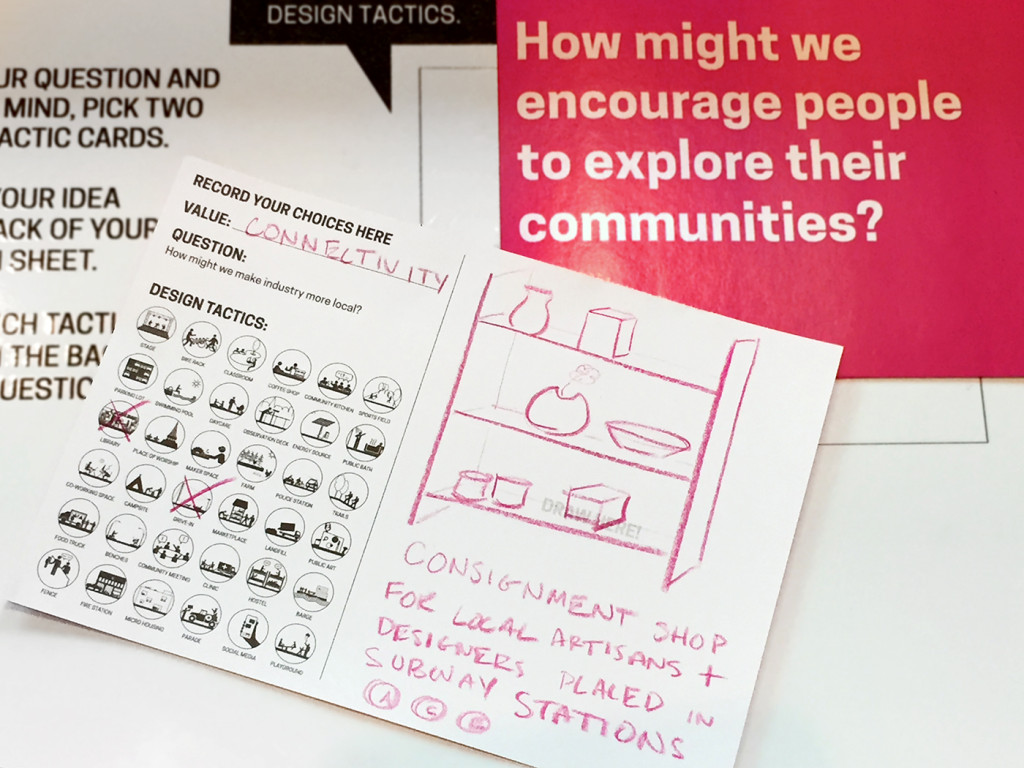
In Process Lab: Citizen Designer participants moved through a series of prompts and completed a worksheet [fig. 2]. Selecting a value they care about, a question that matters, and design tactics they could use to make a difference, participants used these constraints to create a sketch of a potential solution.

Design Brief

Cooper Hewitt’s Education Department asked Digital & Emerging Media (D&EM) to build an interactive experience that would encourage visitors to learn from each other by allowing them to share and compare their participation in exhibition Process Lab: Citizen Designer.

I served as project manager and user-experience/user-interaction designer, working closely with D&EM’s developer, Rachel Nackman, on the project. Interface Studio Architects (ISA) collaborated on concept and provided environmental graphics.

Fig. 2. Completed worksheet with question, value and tactic selections, along with a solution sketch

Fig. 2. Completed worksheet with question, value and tactic selections, along with a solution sketch

Process: Ideation

Project collaborators—D&EM, the Education Department, and ISA—came together for the initial steps of ideation. Since the exhibition concept and design was well established at this time, it was clear how participants would engage with the activity. Through the process of using cards and prompts to complete a worksheet they would generate several pieces of information: a value, a question, one to two tactic selections, and a solution sketch. The group decided that these elements would provide the content for the “sharing and comparing” specification in the project brief.

Of the participant-generated information, the solution sketch stood out as the only non-discrete element. We determined that given the available time and budget, a simple analog solution would be ideal. This became a series of wall-mounted display bins in which participants could deposit their completed worksheets. This left value, question, and tactic information to work with for the content of the digital interactive.

From the beginning, the Education Department mentioned a “broadcast wall.” Through conversation, we unpacked this term and found a core value statement within it. Phrased as a question, we could now ask:

“How might we empower participants to think about themselves within a community so that they can be inspired to design for social change?”

Framing this question allowed us to outline project objectives, knowing the solution should:

  • Help form a virtual community of exhibition participants.
  • Allow individual participants to see themselves in relation to that community.
  • Encourage participants to apply learnings from the exhibition other communities

Challenges

As the project team clarified project objectives, we also identified a number of challenges that the design solution would need to navigate:

  • Adding Value, Not Complexity. The conceptual content of Process Lab: Citizen Designer was complex. The design activity had a number of steps and choices. The brief asked that D&EM add features to the experience, but the project team also needed to mitigate a potentially heavy cognitive load on participants.
  • Predetermined Technologies. An implicit part of the brief required that D&EM incorporate the Pen into user interactions. Since the Pen’s NFC-reading technology is embedded throughout Cooper Hewitt, the digital interactive needed to utilize this functionality.
  • Spatial Constraints. Data and power drops, architectural features, and HVAC components created limitations for positioning the interactive in the room.
  • Time Constraints. D&EM had two months to conceptualize and implement a solution in time for the opening of the exhibition.
  • Adapting to an Existing Design. D&EM entered the exhibition design process at it’s final stages. The solution for the digital interactive had to work with the established participant-flow, environmental graphics, copy, furniture, and spatial arrangement conceived by ISA and the Education Department.
  • Budget. Given that the exhibition design was nearly complete, there was virtually no budget for equipment purchases or external resourcing.

Process: Defining a Design Direction

From the design brief, challenges, objectives, and requirements established so far, we could now begin to propose solutions. Data visualization surfaced as a potential way to fulfill the sharing, comparing and broadcasting requirements of the project. A visualization could also accommodate the requirement to allow an individual participants to compare themselves to the virtual exhibition community by displaying individual data in relation to the aggregate.

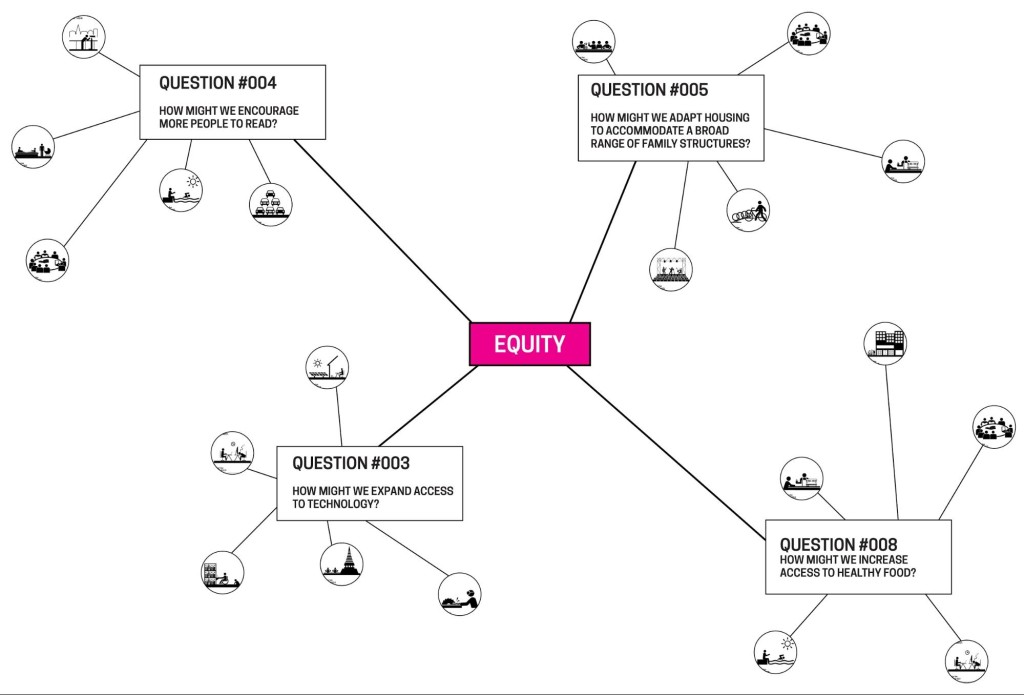
ISA and I sketched ideas for the data visualization [figs. 3 and 4], exploring a variety of structures. As the project team shared and reviewed the sketches, discussion revealed some important requirements for the data organization:

  • The question, value and tactic information should be hierarchically nested.
  • The hierarchy should be arranged so that question was the parent of value, and value was the parent of tactics.
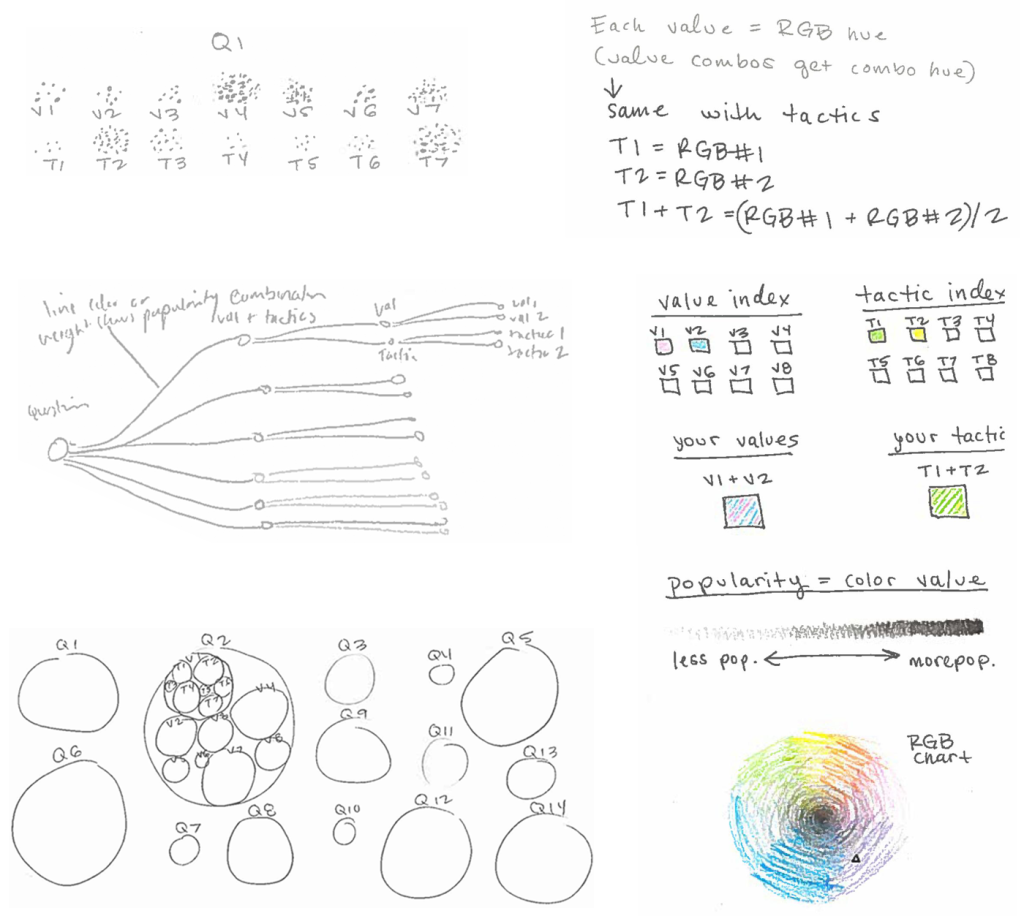
Fig. 3. My early data visualization sketches

Fig. 3. My early data visualization sketches

Fig. 4. ISA’s data visualization sketch

Fig. 4. ISA’s data visualization sketch

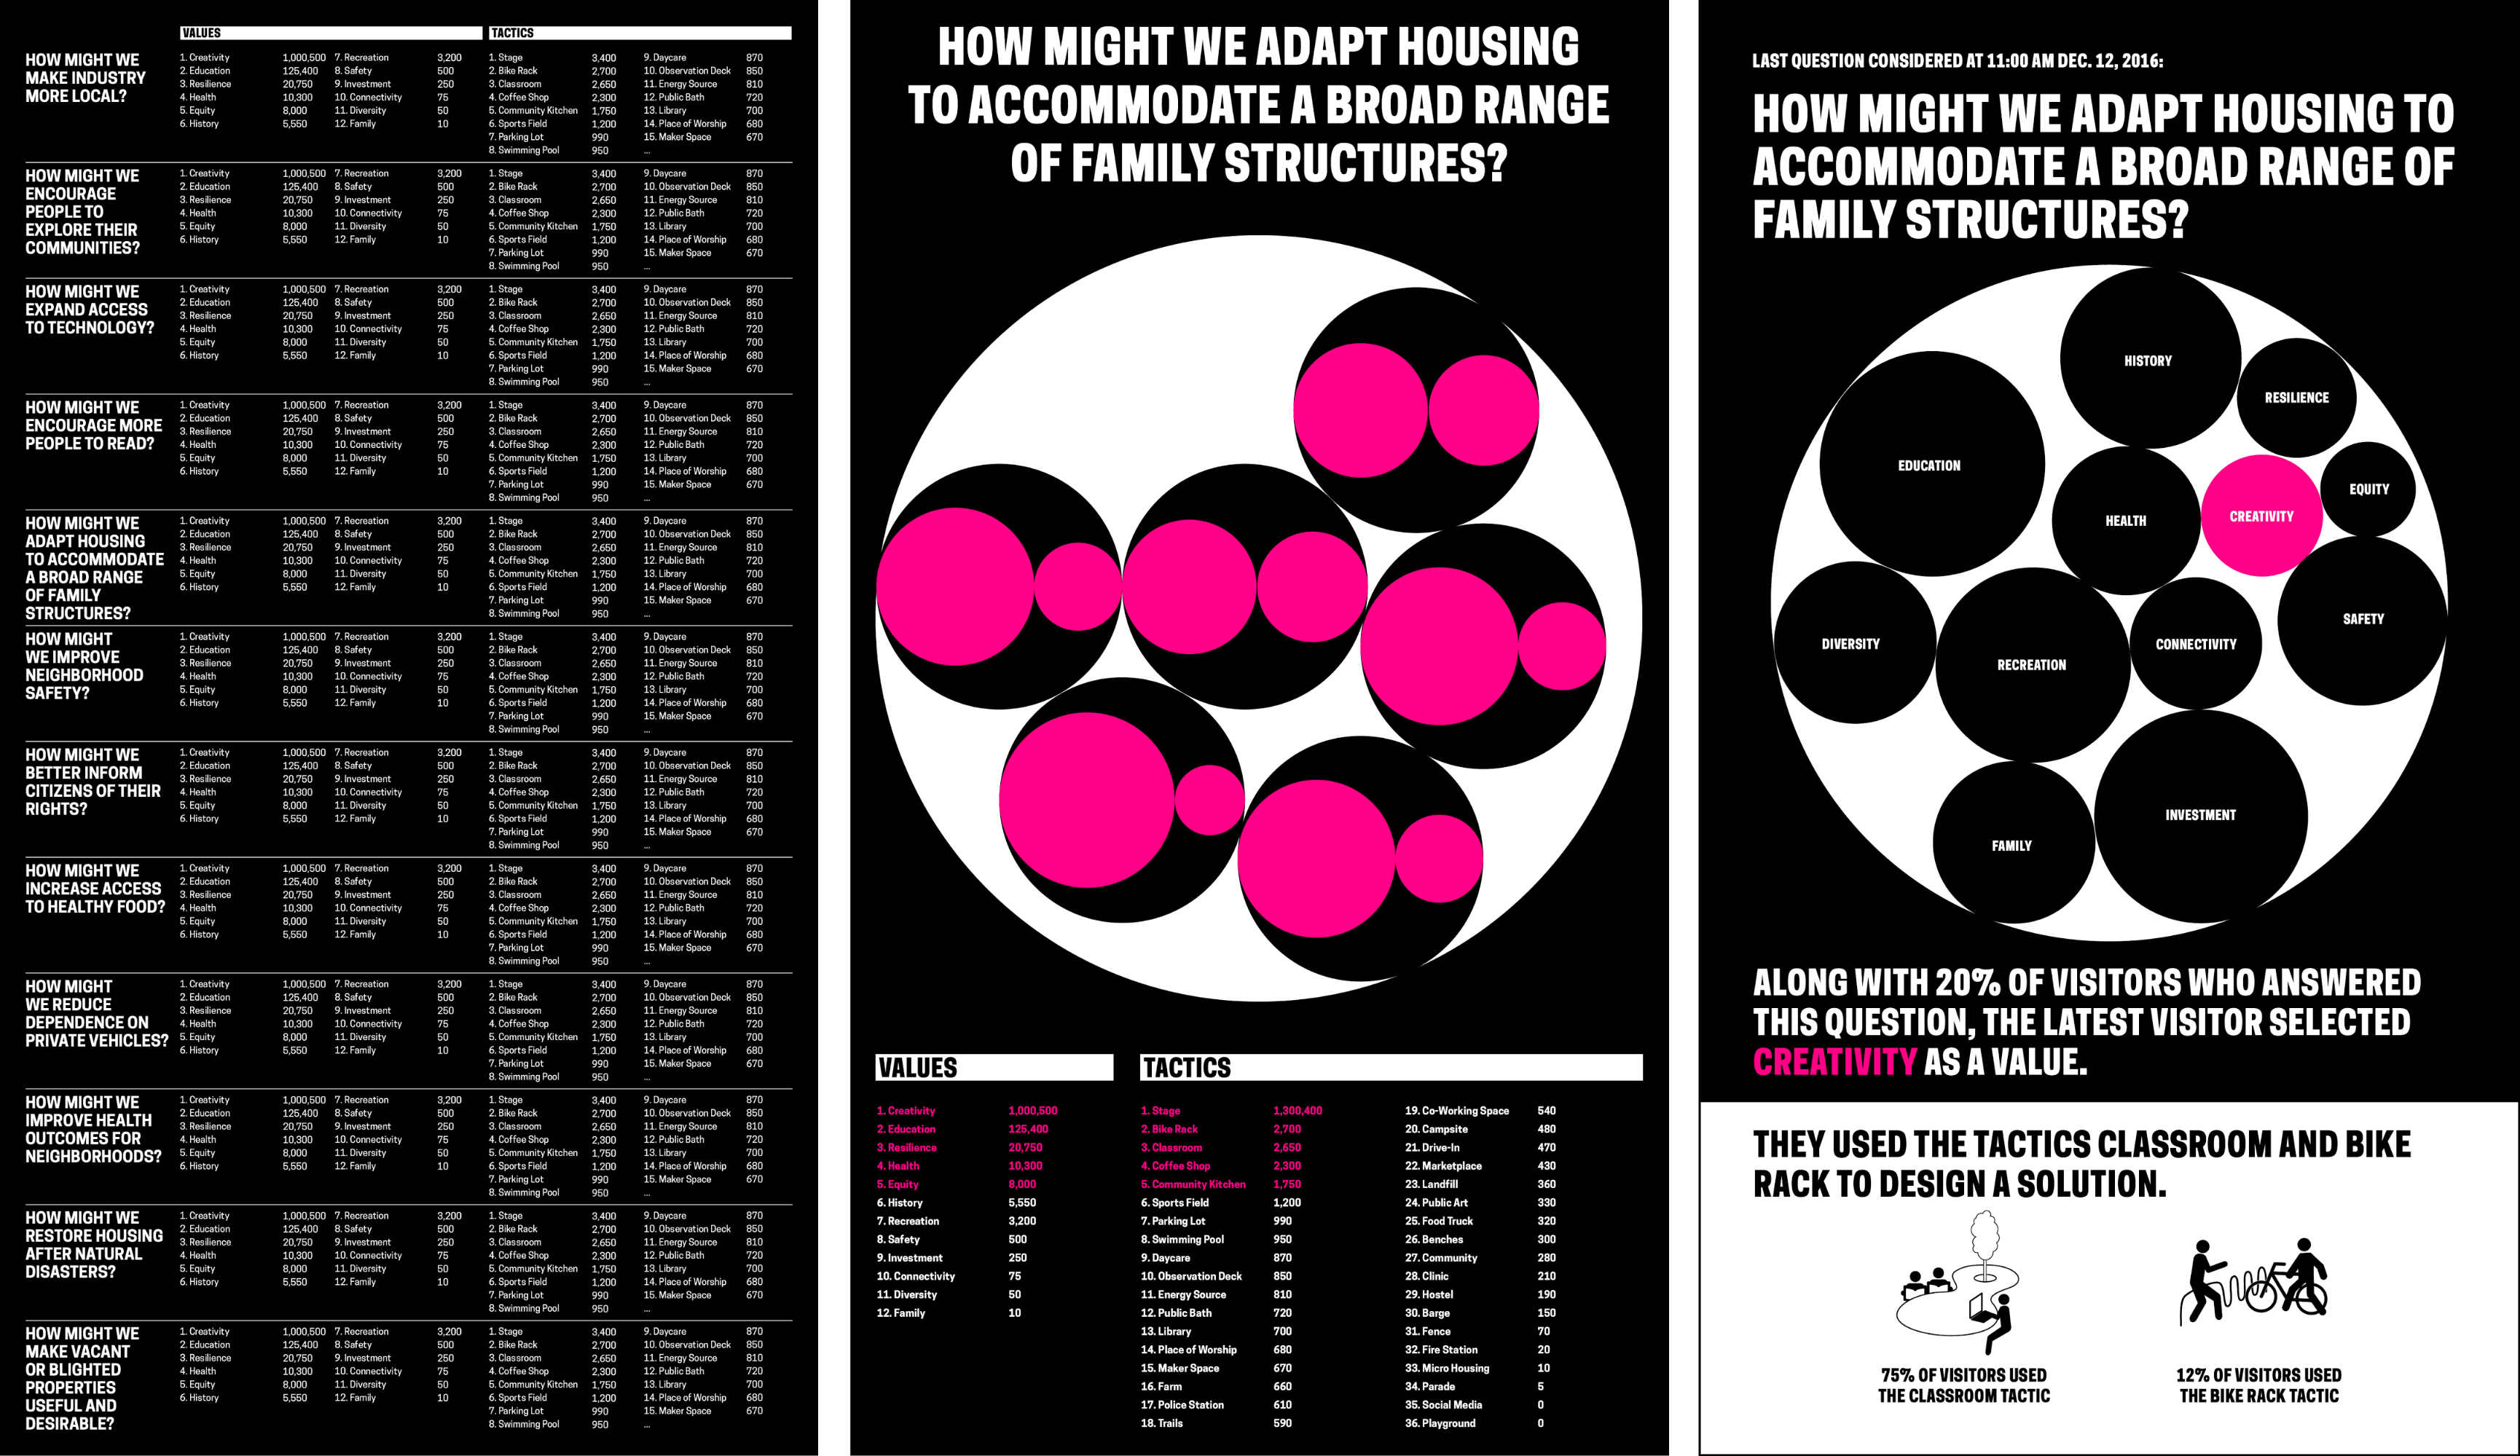
With this information in hand, Rachel proceeded with the construction of the database that would feed the visualization. The project team identified an available 55-inch monitor to display the data visualization in the gallery; oriented vertically it could fit into the room. As I sketched ideas for data visualizations I worked within the given size and aspect ratio. Soon it became clear that the number of possible combinations within the given data structure made it impossible to accommodate the full aggregate view in the visualization. To illustrate the improbability of showing all the data, I created a leaderboard with mock values for the hundreds of permutations that result from the combination of 12 value, 12 question and 36 tactic selections [fig. 5, left]. Not only was the volume of information overwhelming on the leaderboard, but Rachel and I agreed that the format made no interpretive meaning of the data. If the solution should serve the project goal to “empower participants to think about themselves within a community so that they can be inspired to design for social change,” it needed to have a clear message. This insight led to a series steps towards narrativizing the data with text [fig. 5].

Concurrently, the data visualization component was taking shape as an enclosure chart, also known as a circle packing representation. This format could accommodate both hierarchical information (nesting of the circles) and values for each component (size of the circles). With the full project team on board with the design direction, Rachel began development on the data visualization using D3.js library.

Fig. 5. Series of mocks moving from a leaderboard format to a narrativized presentation of the data with an enclosure chart

Fig. 5. Series of mocks moving from a leaderboard format to a narrativized presentation of data with an enclosure chart

Process: Refining and Implementing a Solution

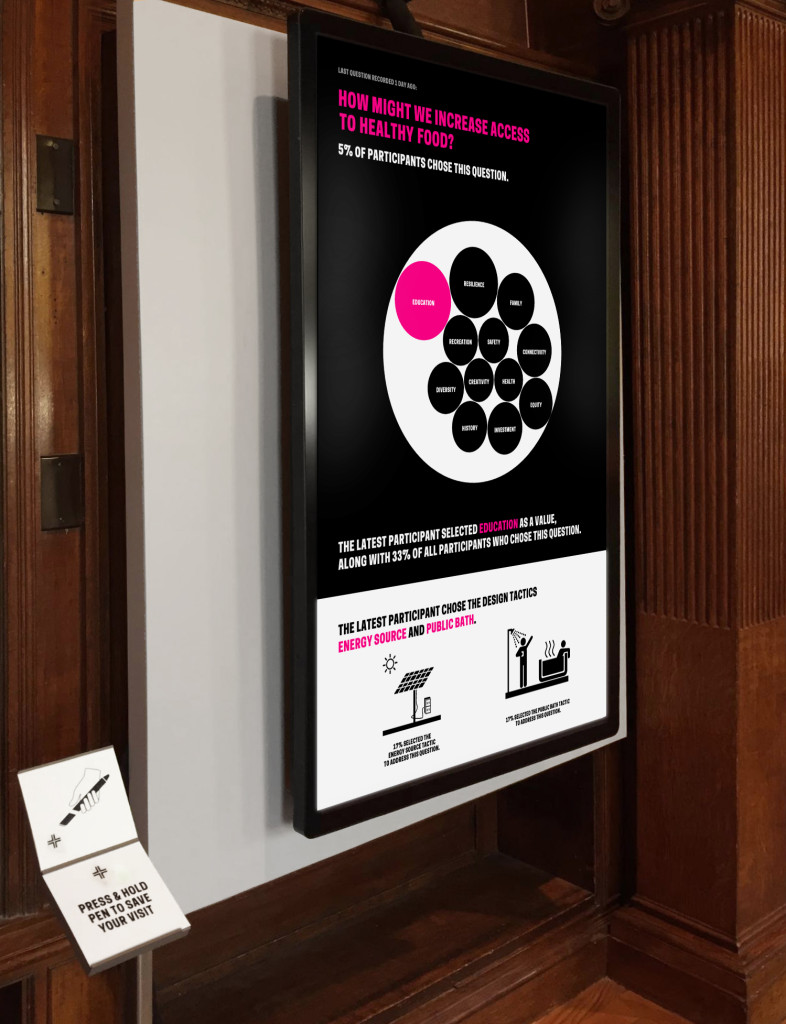
Through parallel work and constant communication, Rachel and I progressed through a number of decisions around visual presentation and database design. We agreed that to enhance legibility we should eliminate tactics from the visualization and present them separately. I created a mock that applied Cooper Hewitt’s brand to Rachel’s initial implementation of the enclosure chart. I proposed copy that wrapped the data in understandable language, and compared the latest participant to the virtual community of participants. I opted for percentage values to reinforce the relationship of individual response to aggregate. Black and white overall, I used hot pink to highlight the relationship between the text and the data visualization. A later iteration used pink to indicate all participant data points. I inverted the background in the lower quarter of the screen to separate tactic information from the data visualization so that it was apparent this data was not feeding into the enclosure chart, and I utilized tactic icons provided by ISA to visually connect the digital interactive to the worksheet design [fig. 2].

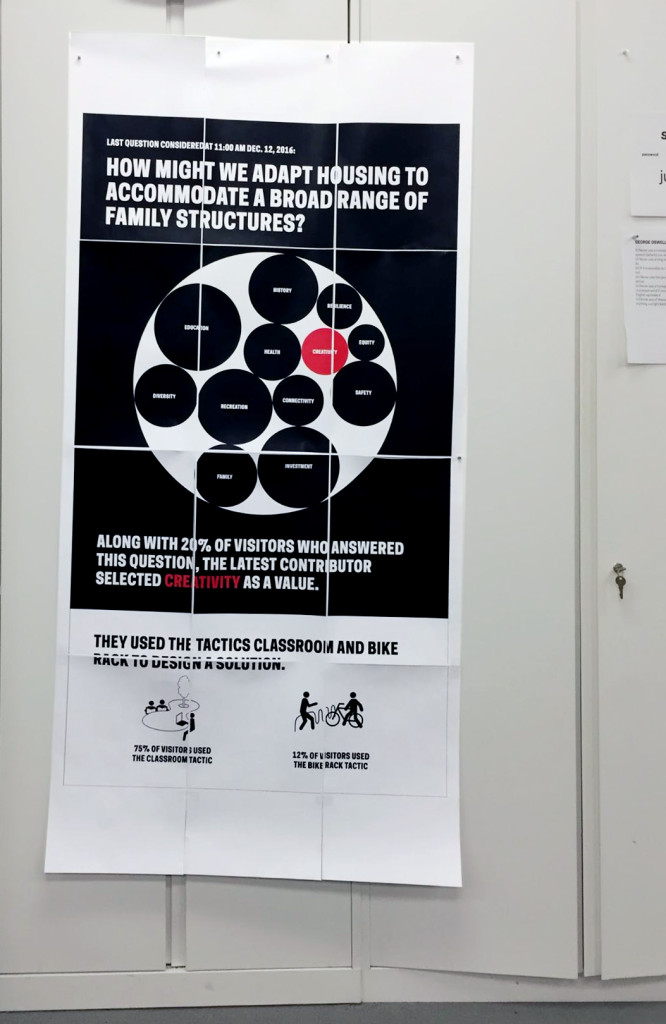
Next, I printed a paper prototype at scale to check legibility and ADA compliance. This let us analyze the design in a new context and invited feedback from officemates. As Rachel implemented the design in code, we worked with Education to hone the messaging through copy changes and graphic refinements.

Fig. 5. A paper prototype made to scale invited people outside the project team to respond to the design, and helped check for legibility

Fig. 5. A paper prototype made to scale invited people outside the project team to respond to the design, and helped check for legibility

The next steps towards project realization involved integrating the data visualization into the gallery experience, and the web experience on collection.cooperhewitt.org, the collection website. The Pen bridges these two user-flows by allowing museum visitors to collect information in the galleries. The Pen is associated with a unique visit ID for each new session. NFC tags in the galleries are loaded with data by curatorial and exhibitions staff so that visitors can use the Pen to save information to the onboard memory of the Pen. When they finish their visit the Pen data is uploaded by museum staff to a central database that feeds into unique URLs established for each visit on the collection site.

The Process Lab: Citizen Designer digital interactive project needed to work with the established system of Pens, NFC tags, and collection site, but also accommodate a new type of data. Rachel connected the question/value/tactic database to the Cooper Hewitt API and collections site. A reader-board at a freestanding station would allow participants to upload Pen data to the database [fig. 6]. The remaining parts of the participant-flow to engineer were the presentation of real time data on the visualization screen, and the leap from the completed worksheet to digitized data on the Pen.

Rachel found that her code could ping the API frequently to look for new database information to display on the monitor—this would allow for near real-time responsiveness of the screen to reader-board Pen data uploads. Rachel and I decided on the choreography of the screen display together: a quick succession of entries would result in a queue. A full queue would cycle through entries. New entries would be added to the back of the queue. An empty queue would hold on the last entry. This configuration assumed that if the queue was full when they added their entry participants may not see their data immediately. We agreed to offload the challenge of designing visual feedback about the queue length and succession to a subsequent iteration in service of meeting the launch deadline. The queue length has not proven problematic so far, and most participants see their data on screen right away.

Fig. 6. Monitor displaying the data visualization website; to the left is the reader-board station

Fig. 6. Monitor displaying the data visualization website; to the left is the reader-board station

As Rachel and I brought the reader board, data visualization database, and website together, ISA worked on the graphic that would connect the worksheet experience to the digital interactive. The project team agreed that NFC tags placed under a wall graphic would serve as the interface for participants to record their worksheet answers digitally [fig. 7].

Fig. 7. ISA-designed “input graphic” where participants record their worksheet selections; NFC tags beneath the circles write question, value and tactic data to the onboard memory of the Pen

Fig. 7. ISA-designed “input graphic” where participants record their worksheet selections; NFC tags beneath the circles write question, value and tactic data to the onboard memory of the Pen

Process: Installation, Observation & Iteration

Rachel and I had the display website ready just in time for exhibition installation. Exhibitions staff and the project team negotiated the placement of all the elements in the gallery. Because of obstacles in the room, as well as data and power drop locations, the input wall graphic [fig. 7] had to be positioned apart from the reader-board and display screen. This was unfortunate given the interconnection of these steps. Also non-ideal was the fact that ISA’s numeric way-finding system omitted the step of uploading Pen data at the reader-board and viewing the data on-screen [fig.1]. After installation we had concerns that there would be low engagement with the digital interactive because of its disconnect from the rest of the experience.

As soon as the exhibition was open to the public we could see database activity. Engagement metrics looked good with 9,560 instances of use in the first ten days. The quality of those interactions, however, was poor. Only 5.8% satisfied the data requirements written into the code. The code was looking for at least one question, one value, and one tactic in order to process the information and display it on-screen. Any partial entries were discounted.

Fig. 8. A snippet of database entries from the first few days of the exhibition showing a high number of missing question, value and tactic entries

Fig. 8. A snippet of database entries from the first few days of the exhibition showing a high number of missing question, value and tactic entries

Conclusion

The project team met the steep challenges of limited time and budget—we designed and built a completely new way to use the Pen technology. High engagement with the digital interactive showed that what we created was inviting, and fit into the participatory context of the exhibition. Database activity, however, showed points of friction for participants. Most had trouble selecting a question, value and tactic on the input graphic, and most did not successfully upload their Pen data at the reader-board. Stringent database requirements added increased difficulty.

Based on these observations, it is clear that the design of the digital interactive could be optimized. We also learned that some of the challenges facing the project could have been mitigated by closer involvement of D&EM with the larger exhibition design effort. Our next objective is to stabilize the digital interactive at an acceptable level of usability. We will continue observing participant behavior in order to inform our next iterations toward a minimum viable product. Once we meet the usability requirement, our next goal will be to hand-off the interactive to gallery staff for continued maintenance over the duration of the exhibition.

As an experience, the Process Lab:Citizen Designer digital interactive has a ways to go, but we are excited by the project’s role in expanding how visitors use the Pen. This is the first time that we’ve configured Pen interactivity to allow visitors to input information and see that input visualized in near real-time. There’s significant potential to reuse the infrastructure of this project again in a different exhibition context, adapting the input graphic and data output design to a new educational concept, and the database to new content.

Object Phone: The continued evolution of a little chatbot

Object Phone is a project that started small, took less than a day to code, and consisted of about a page of code. Initially it was just an experiment–a way for me to explore a new interface to our API. Object Phone allowed users to call or text objects in our collection, and receive some kind of response. It was met with mild fanfare.

Next, I was curious about using Object Phone in our galleries. I looked towards developing some better audio content, and we decided to produce a short audio tour of the David Adjaye Selects exhibit. It was somewhat cumbersome to use but an interesting experiment and one of my first “in-gallery beta-tests.” Needless to say, I tried to be as clear as possible that this was an “experiment.”

Later I started thinking about the broader uses for a system like Object Phone. Could it replace an expensive audio guide? Could it be used as an accessibility device? I started to think of many possible uses for the platform, and started to rewrite the code to support multiple outputs. In a way, I was thinking about the code for Object Phone as a mini framework for building voice and text based interactions with our content.

All of this got put on the back burner for a while. Object Phone is after all my little side project. Something I come back to when I need to center myself and let my brain think through a few problems. It’s very much a project I meditate on when I need to do that kind of thing.

About 6 months later I started playing with the code again. I realized it was pretty trivial to deliver images via MMS using Twilio’s API and I had also started to notice that MMS worked pretty nicely on devices like an Apple Watch, and looked pretty good in the notification screen on my iPhone. All of the sudden it was kind of fun again to receive texts from Object Phone. So, I set up a subscription service.

Inspired by a few chatty SMS based apps out there like Poncho and The Edit, I built a simple subscription service that would send random objects and images to subscribers once a day at noon. Again, I set this up quickly, sent out a request for some people to try it out, and started to make realizations.

Object Phone is getting some upgrades. Feature requests welcome.

A photo posted by Micah Walter (@micahwalter) on

The main realization I had was that Object Phone had just become a chatbot. To be clear, Object Phone has technically always been a chatbot. You send it messages, and it replies with some response. But now that it sends you something periodically based on your preferences (currently just the preference that you want to continue receiving messages) it seems more like a real chatbot. More importantly, this experiment has started to make me “think” of Object Phone as a chatbot–something I should have likely realized from the start.

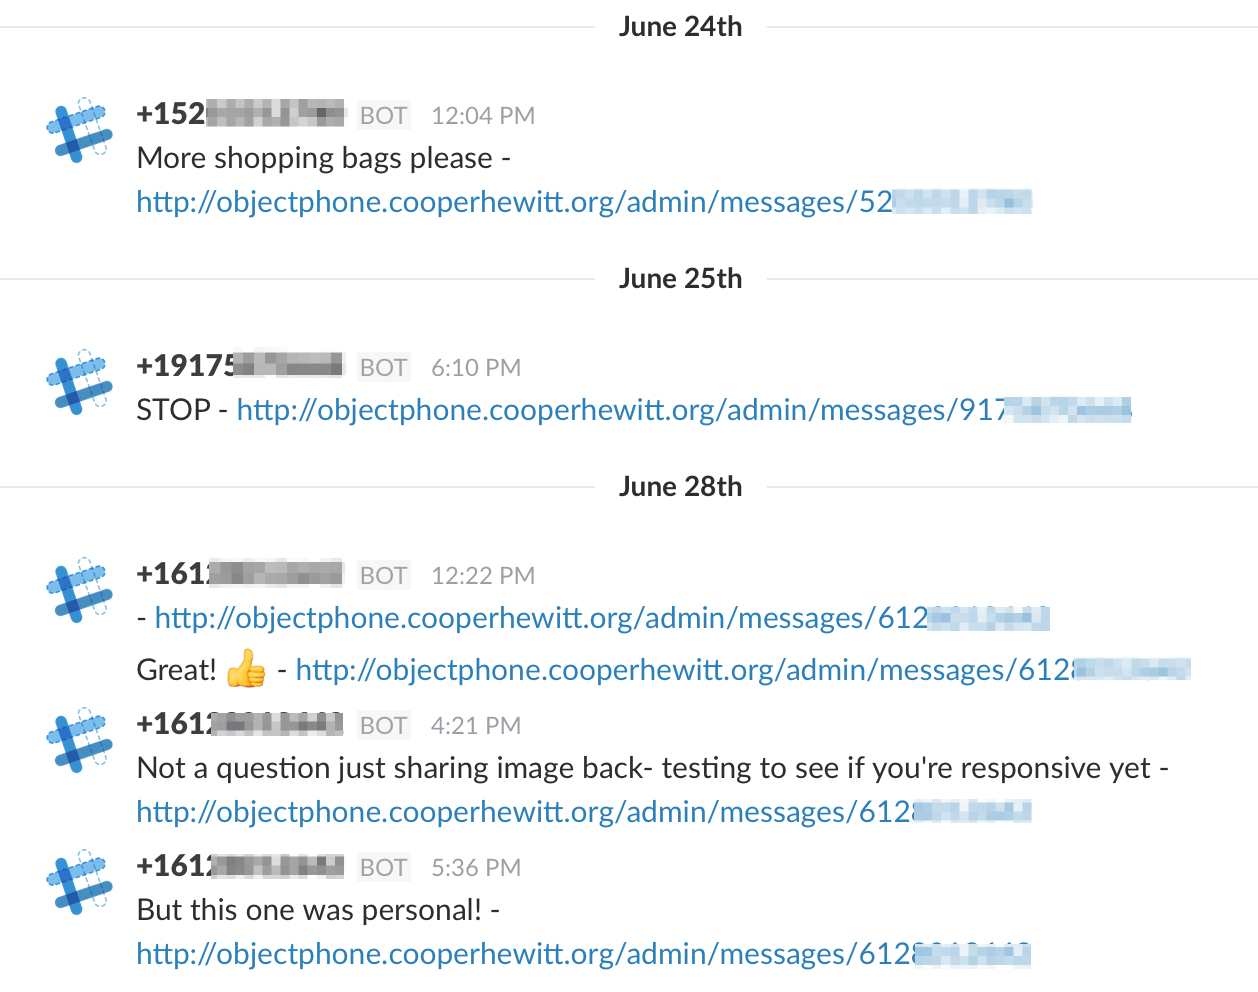
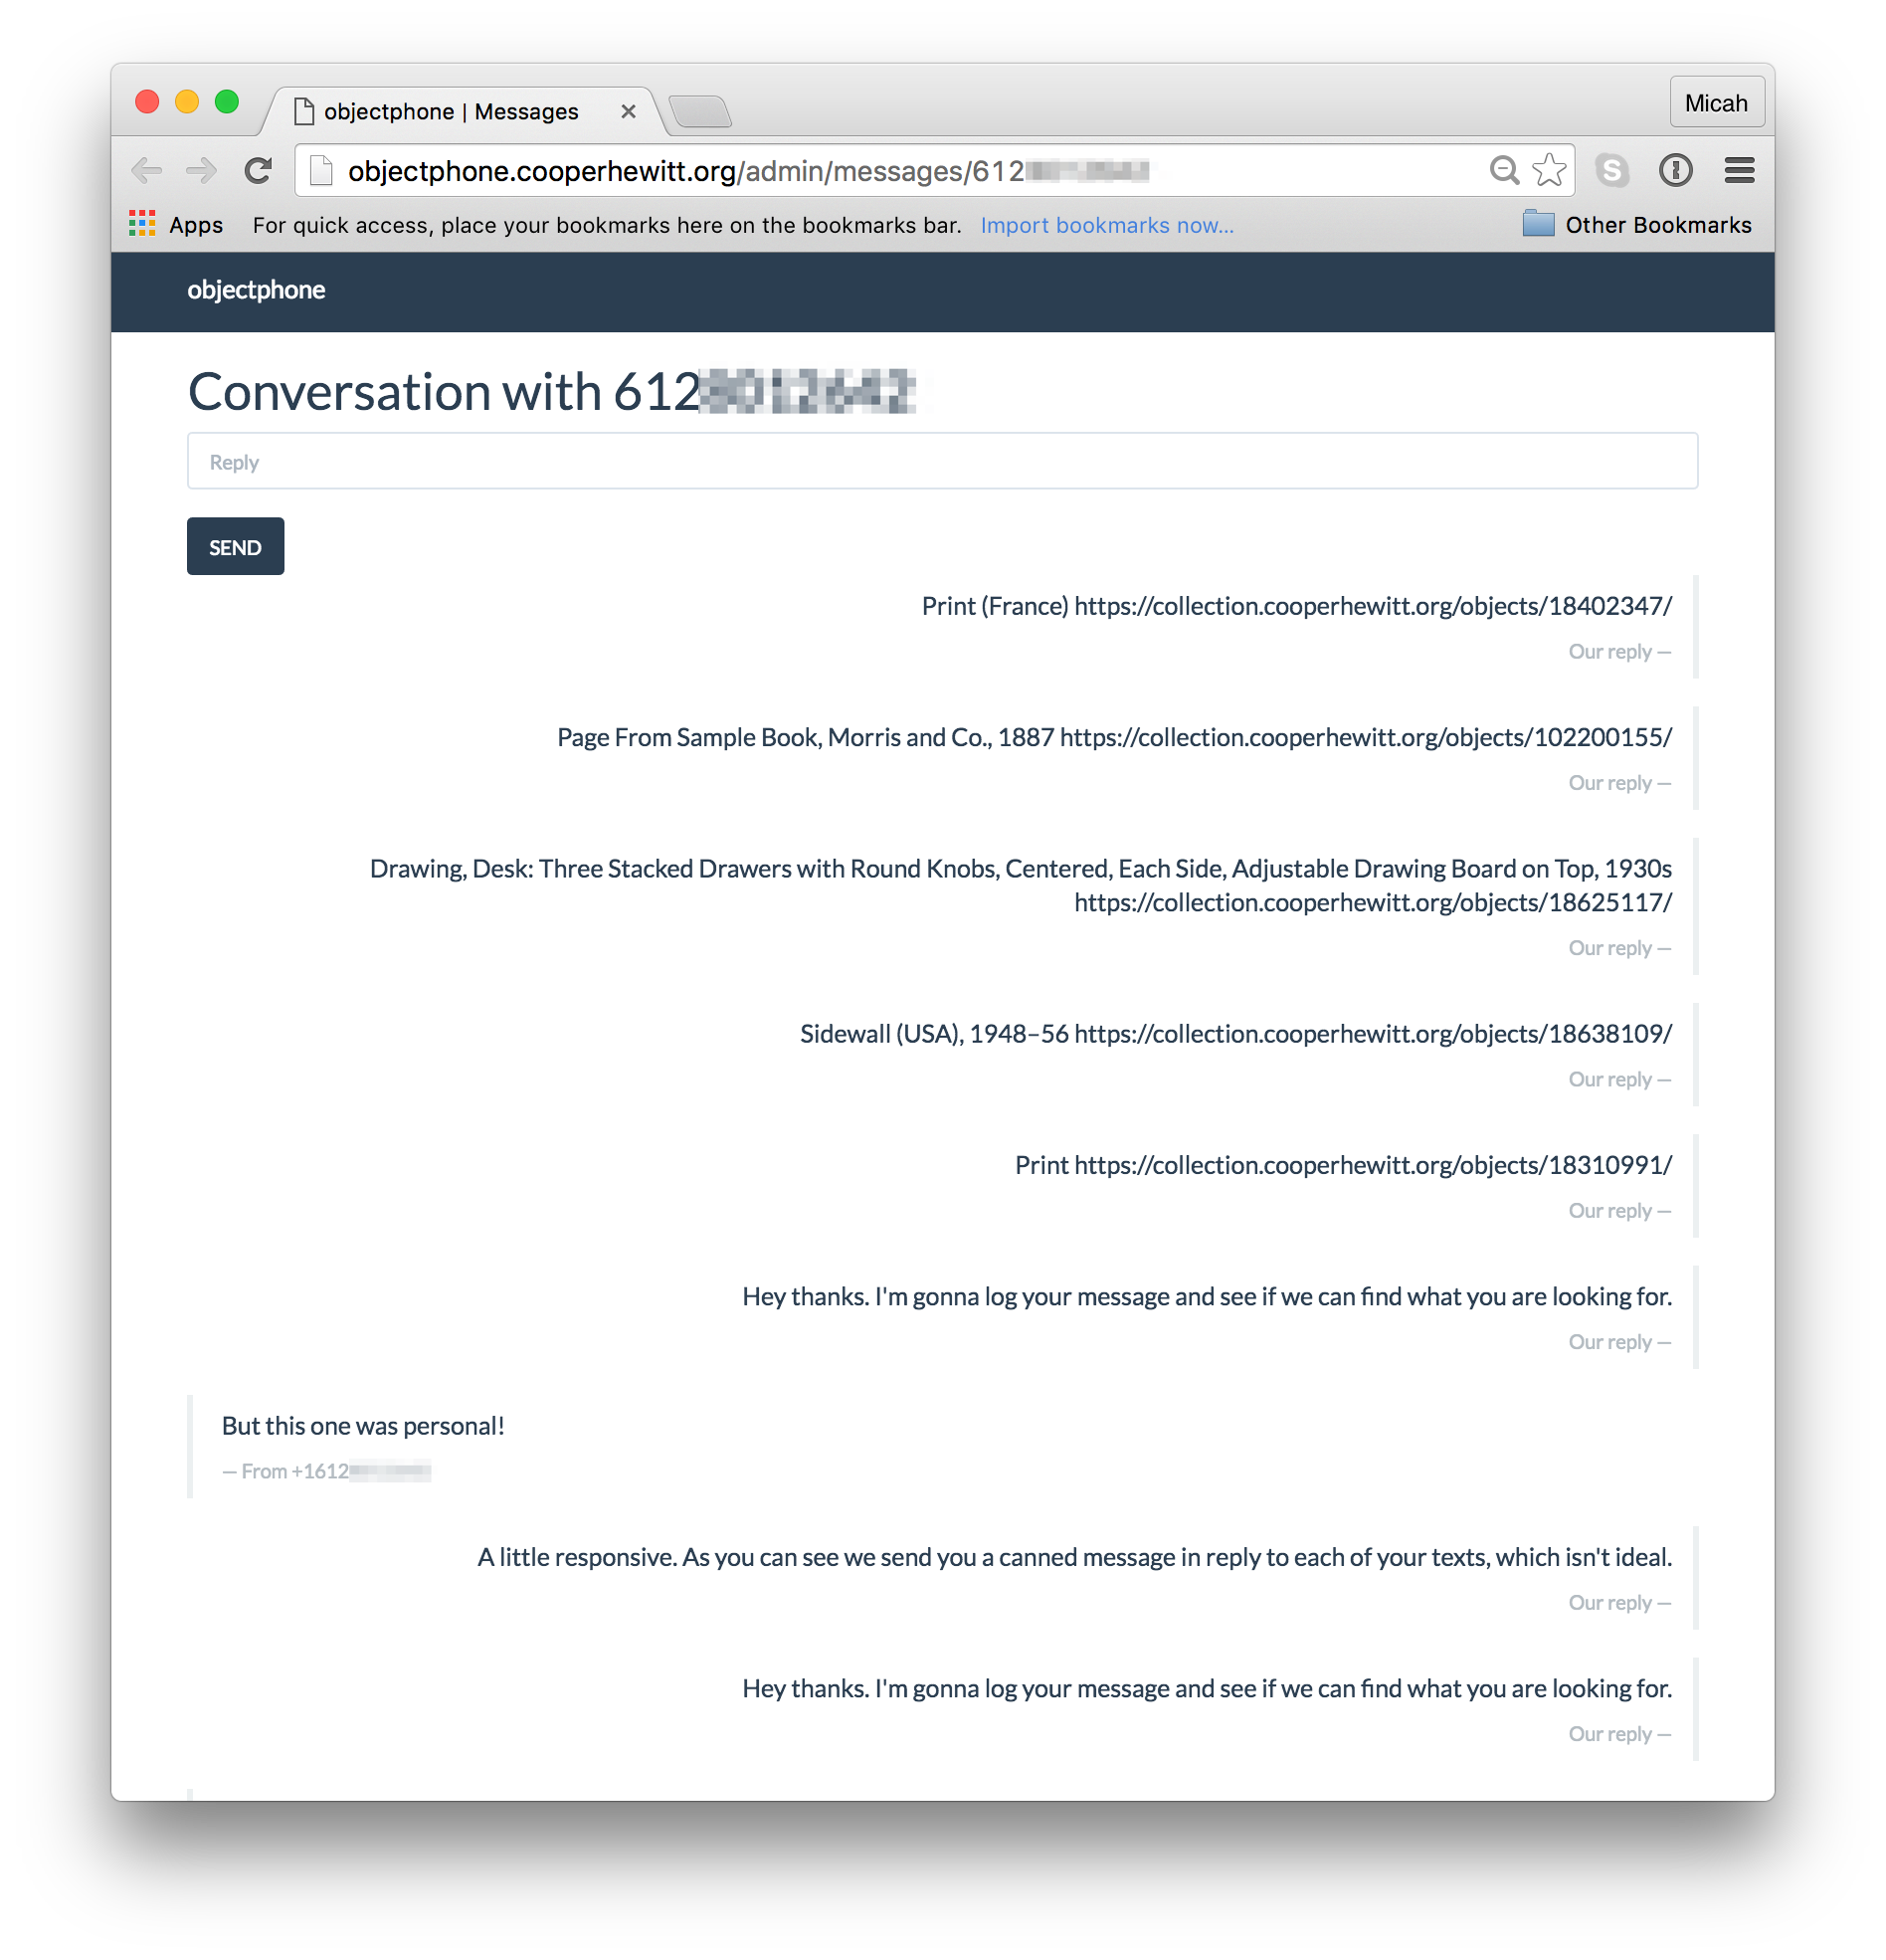
I also realized that Object Phone’s chattiness happens in multiple directions. It indeed chats with its subscribers. It can send you messages once a day, and it can reply to your requests for info about objects with ease. But, I also added a back end feature which follows this same line of thinking. If a user sends Object Phone a message that it doesn’t understand, Object Phone asks me for some assistance. Here is the flow:

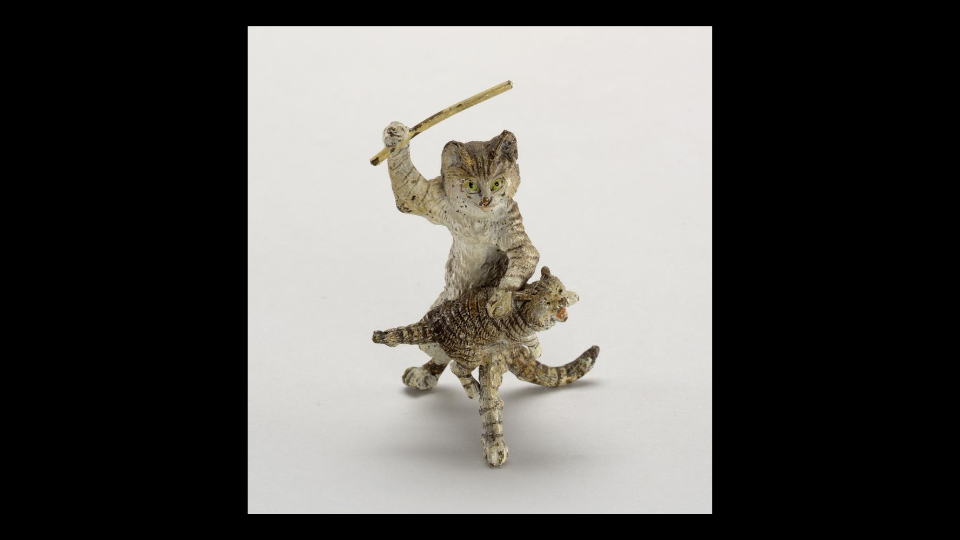
  1. A user messages Object Phone something like “Tell me about spanking cat.”
  2. Object Phone isn’t smart enough yet to decipher the message.
  3. Object Phone replies “OK, I don’t really understand what you are saying but I’ll ask around and get back to you.”
  4. Object Phone then sends our Cooper Hewitt Slack channel a message.
  5. The Slack message contains the user’s phone number, their message, and a link to an admin page where the operator can reply directly to the user.
Screen_Shot_2016-07-04_at_10_13_26_AM

A Slack Channel where Object Phone can tell our staff when it needs a little assistance.

Screen_Shot_2016-07-04_at_10_16_12_AM

An Object Phone admin page where our staff can reply directly to users

All of the sudden Object Phone is a conduit between Cooper Hewitt staff and its visitors. It’s talking directly to visitors, but also relaying messages back and forth to more knowledgeable staff when it needs assistance.

What the cool kids are doing

Conversational user experiences are all the rage right now. Facebook has recently opened up their Messenger platform and API to developers, which means anyone can build a simple chatbot on Facebook and reach all their followers with ease. Many other messaging services have open APIs as well. WeChat, LINE, What’sApp and Slack are just a few examples.

Slack for iOS Upload

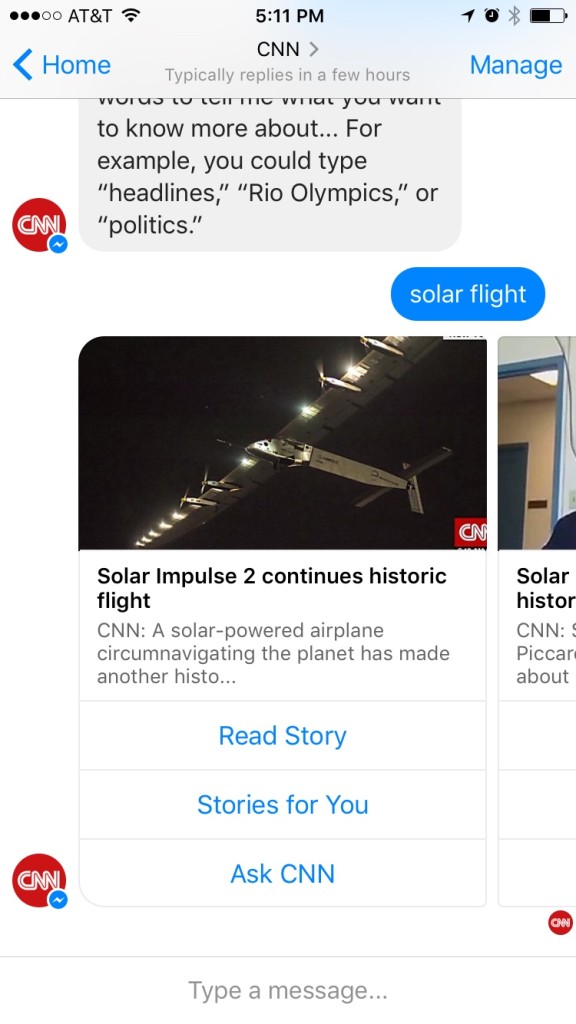
Screenshot of the CNN chatbot for Facebook Messenger

It’s pretty clear that messaging apps are increasing in popularity, with users spending much of their days talking on platforms like SnapChat rather than thumbing through their Facebook feeds. Apple too has followed suit by announcing a much upgraded Messages app in their latest update to iOS.

Chatbots have also become much more sophisticated, with huge advancements in Natural Language Processing and Natural Language Understanding. There is now a wealth of information and publicly available code and APIs out there, making it easier than ever to spin up a pretty intelligent chatbot with little overhead.

The Future of Object Phone

My next steps are to make Object Phone more intelligent. It should be able to learn about your tastes and preferences. If you only want to receive objects from our Textiles department, you should be able to say so. If you want to get your daily update at 5am, you should be able to just tell it that.

More importantly, you should be able to interact with more than just objects. Users should be able to find out general info about our museum. Are we open today? How do I get to Cooper Hewitt? Can I buy tickets right here, right now?

Lastly, I’d love to see Object Phone make its way onto the platform of your choice. I think this is a critical next step. SMS is great, and available to nearly anyone with a cell phone, but apps like FB Messenger, WhatsApp, and LINE have the ability to connect a service like Object Phone with a captive audience, all over the world.

I think institutions like museums have a great opportunity in the chatbot space. If anything it represents a new way to broaden our reach and connect with people on the platforms they are already using. What’s more interesting to me is that chatbots themselves represent a way to interact with people that is by its very nature, bi-directional. It presents us with the challenge of conversation, and forces us to listen to our constituents in a very close and connected kind of a way. We should already be doing this.

If you’d like to participate in testing out Object Phone, please go to https://objectphone.cooperhewitt.org and sign up. You will receive an object every day at 12pm EST until you reply STOP.

Museums and the Web Conference Recap: Administrative Tools at Cooper Hewitt

The Labs team had a great time at Museums and the Web this year. We published two papers for the conference and presented them both to the audience of cultural heritage thinkers, makers, planners and administrators. Sam Brenner and I shared our paper, “Winning (and losing) hearts and minds of museum staff: Administrative interfaces at Cooper Hewitt,” which outlines the process of designing, developing and iterating two in-house built, staff-facing tools: Tagatron and the Pen Pairing Station. Both administrative tools are essential aides to staff managing new responsibilities associated with visitor-facing gallery technologies.

Here is the deck from our presentation:

Administrative interfaces at Cooper Hewitt (14)

Administrative interfaces at Cooper Hewitt

Introduction

  • Cooper Hewitt, Smithsonian Design Museum. New York, New York.
  • Our strategy around presenting design is to expose process—how things are made, how they are conceived, how they are designed.
  • This presentation will speak to our philosophy of openness around design process in sharing part of the back-story of how our current visitor-facing experience came together and how it’s maintained.

Administrative interfaces at Cooper Hewitt (1)

Visitor Interfaces

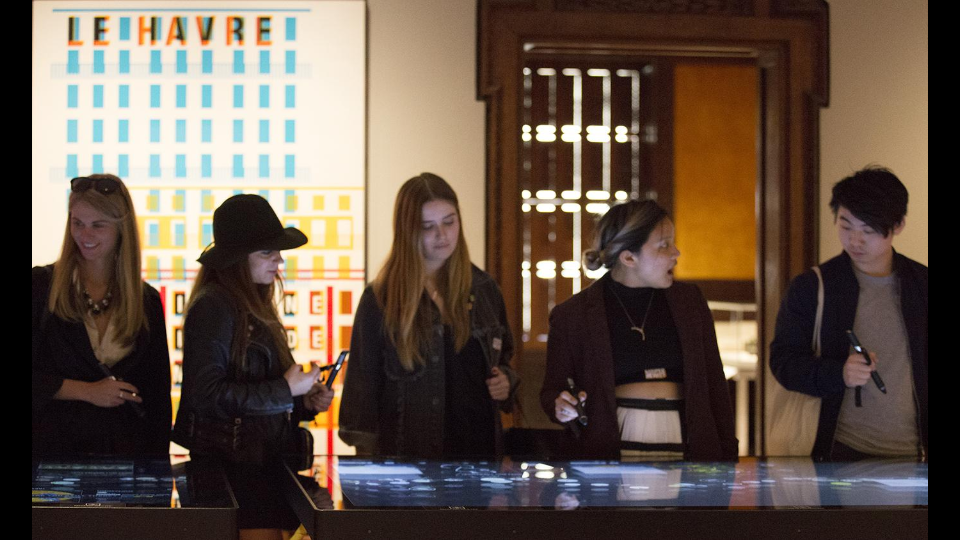
  • The visitor-facing technologies in the museum, introduced in 2014, invite new forms of engagement with the Cooper Hewitt collection. They encourage active participation, letting visitors play, design and collect through multi-touch table applications and the Pen.
  • Before we were able to re-design the visitor’s relationship to the museum we went through comprehensive changes at every level.

Administrative interfaces at Cooper Hewitt (2)

Comprehensive Re-design / Institutional Shift

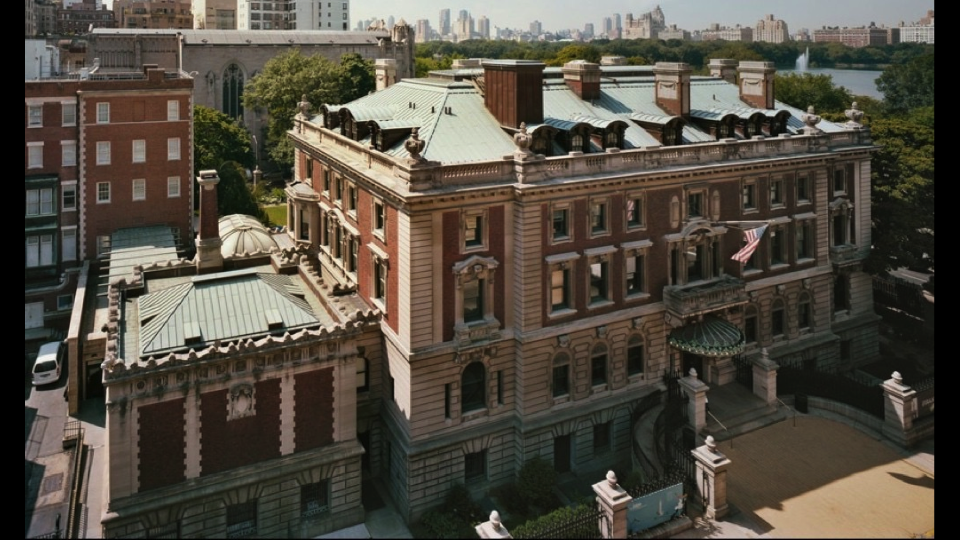
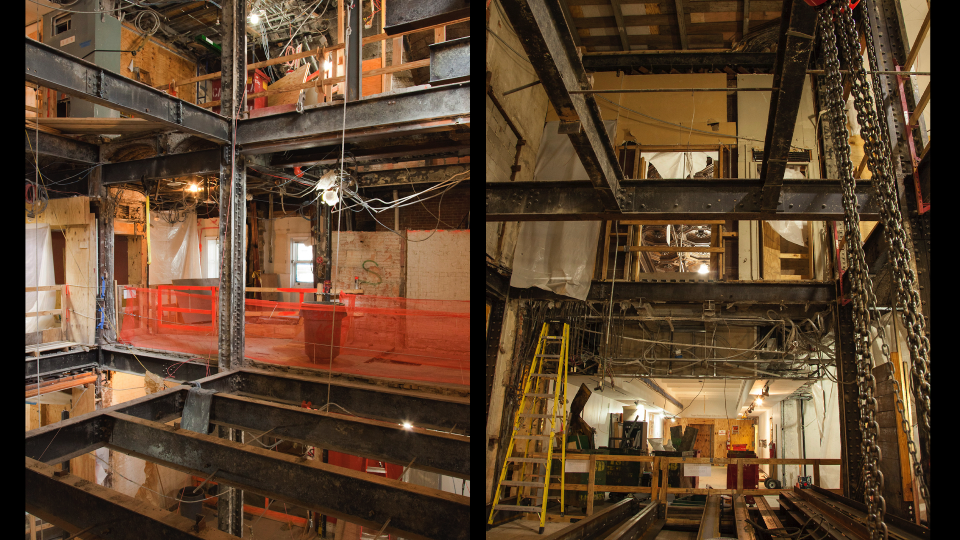
  • We began a restoration of the mansion, stripping it down to its Carnegie steel girders.
  • To a similar degree we rethought the organizational infrastructure of Cooper Hewitt with a comprehensive re-design of operations, workflows and responsibilities.

Administrative interfaces at Cooper Hewitt (3)

New Responsibilities (for Everyone)

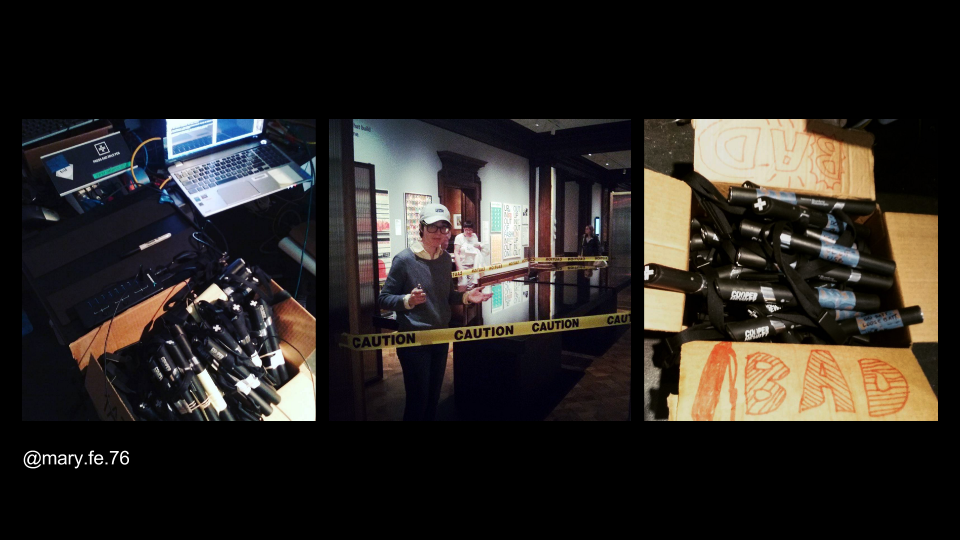
  • There were new jobs created to support the new visitor experience, including that of our Gallery Technology Manager, Mary Fe, whose job responsibilities include maintaining the Pens and troubleshooting touch tables and gallery interactives
  • The re-design affects every staff member at Cooper Hewitt:
  • Registrars: aggressive timetable to enter data
  • Security: understand the mission and visitor experience, teaching visitors on pen usage
  • Exhibitions: label programming, maintenance
  • Curators: tags, relations, chat formatting for length
  • Visitor services: pen pairing – whole new step in between “welcome” and ticket sale
  • Before we got to this stage there was the task of onboarding staff to new responsibilities, which fell largely to the Digital & Emerging Media department. With the allocation of new responsibilities also came the opportunity to create tools that could facilitate some of the work.

Administrative interfaces at Cooper Hewitt (4)

Defining the Need for Considered Interfaces

  • Why did we decide that new interfaces were necessary in certain parts of the workflow?
  • We started with observation, watching workflows as they emerged. We created tools to assist where necessary. The need for interfaces was in part logistical, in part technical and also in part human.
  • Candidates for interface development are parts of the new digital ecosystem where there is:
  • High volume of data
  • Large number of users
  • Complex tasks
  • Something that needs constraints or enforcement
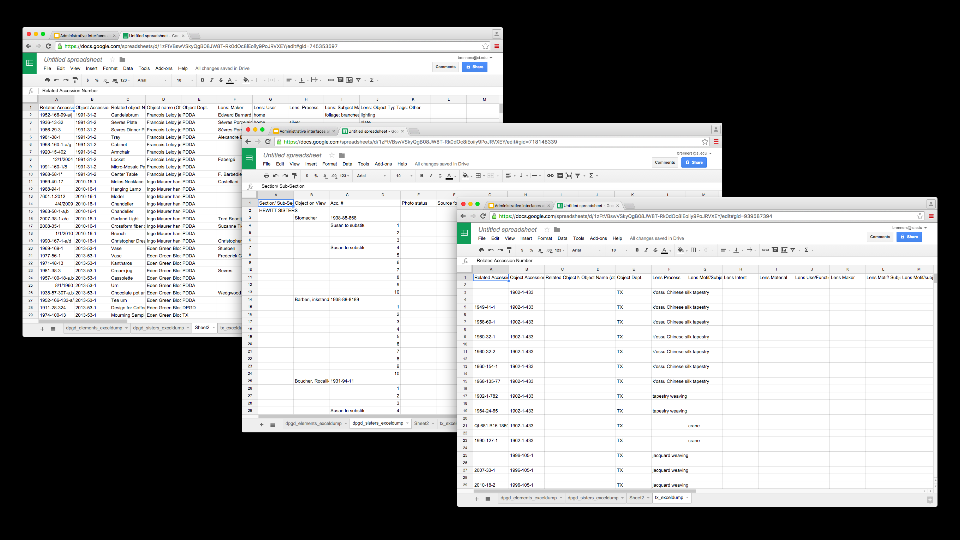
  • Example: the job of assigning tags and related objects to everything we put on display for the reopening. The touch table interfaces utilize tag and related object information. This data does not live in TMS, so it is housed in a custom database.
  • The task of creating the data fell to the curators. Originally this was stored in Excel files. While the curators were happy using spreadsheets, we identified a few major issues with them. The biggest one was that every department had devised their own schema for storing the data, which would ultimately have to be reconciled
  • This example fits all of the criteria above.

Administrative interfaces at Cooper Hewitt (5)

Case Study 1: Tagatron

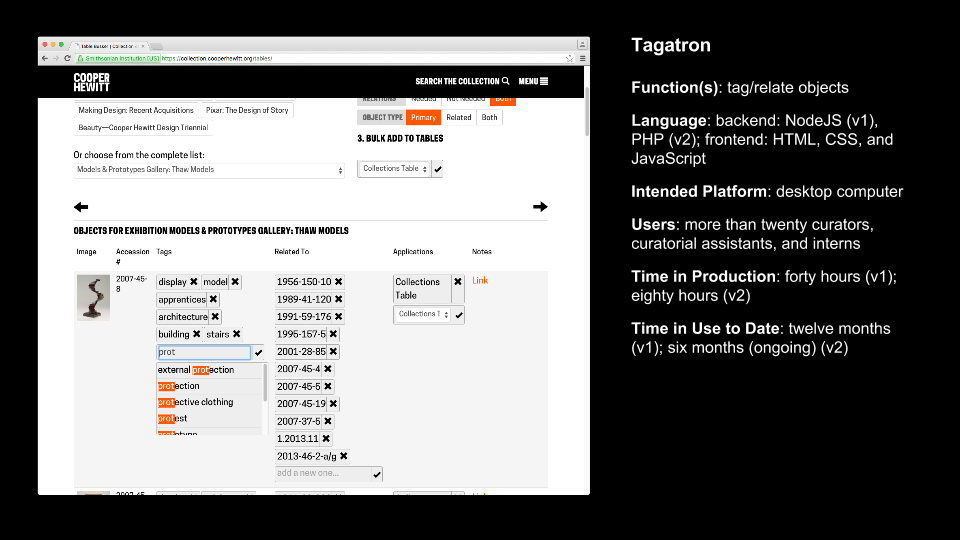
  • Explicit purpose of the Tagatron tool: make the work quicker; make the metadata consistent; make the organization of the metadata consistent
  • Making this tool highlighted for the digital team the complex relationship between the work, the tool, and the people responsible for each—even though we believed the tool made things easier, the tool had its own set of ongoing technical and usability issues
  • We found that those issues propagated an amount of distrust or lack of confidence in the larger project. Some of these were due to bugs in the tool, but some of it was just that now it was known that this was work that would be “enforced” or taken more seriously, which made users uncomfortable.
  • Key idea: the interface takes on a symbolic value in representing “new responsibilities” and can bring about issues that it might not have been designed to address. It takes on a complex position between human needs and technical needs.

Administrative interfaces at Cooper Hewitt (6)

Tagatron (continued)

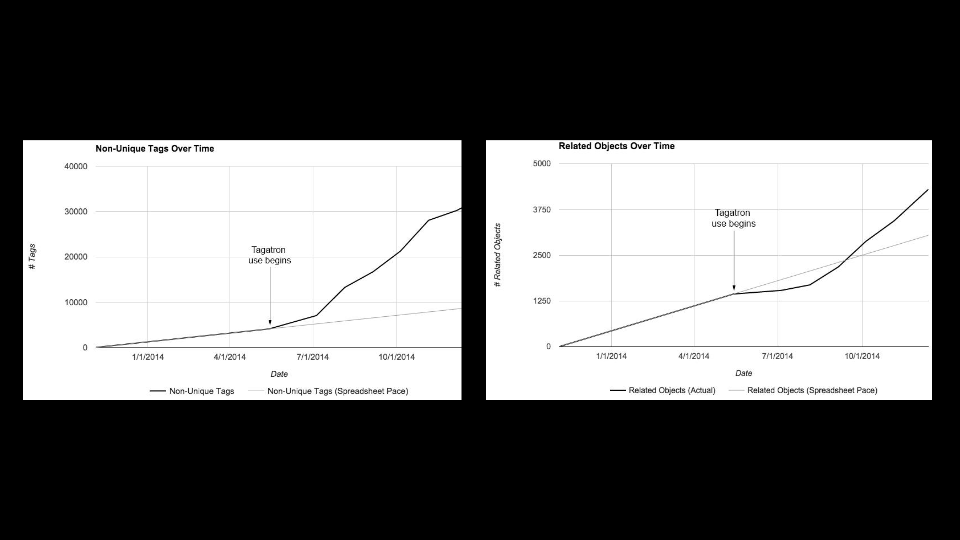
  • These graphs illustrate how prolific the task of tagging and relating objects is. It was important to build Tagatron because it is crucial tool in the ongoing operation of the museum’s digital experience. More so than the spreadsheets ever could, it allows for scalability.
  • Since the re-opening the tool went through one major design and backend overhaul, and continues to see small iterations.

Administrative interfaces at Cooper Hewitt (7)

Case Study 2: Pen Pairing Stations

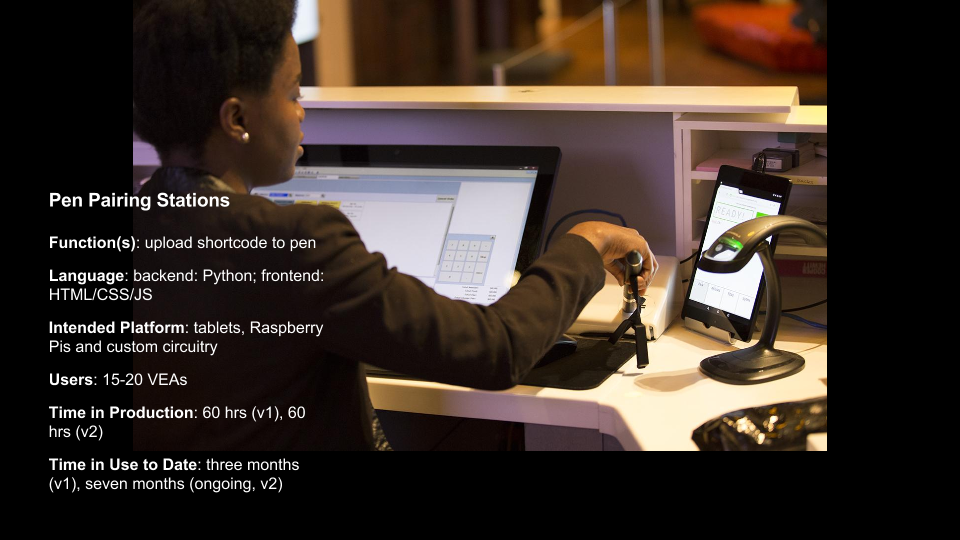
  • Context of Pen Pairing: Every visitor to the museum receives a Pen. At the museum’s front desk each Pen is paired with a unique admission ticket. Every ticket has a shortcode identifier that allows visitors to retrieve their Pen visit data online when they enter the code on their ticket.
  • Pen pairing is done at a very critical point in the visitor experience when the interaction needs to be quick and frictionless. Visitor Services Associates have to coordinate a number of simultaneous tasks.

Pen Pairing Station (continued)

  • This video depicts the Pen pairing process behind the front desk. It documents the first version of the Pen Pairing application, and shows the exposed Pen-reading circuit board before housing was built.
  • Pen pairing is one of the most demanding of the new responsibilities created by the “new experience”–has to fit between welcoming a visitor, taking their money, answering any questions, looking up their member ID.
  • Each use of the tool only lasts 5-10 seconds but we’ve spent many hours and built many versions of this tool to figure out exactly what needs to happen in that time to accomplish all the tasks, including updating databases, handling failures, serial communication
  • Every one of these iterations gave us an opportunity to be connected to the staff using the tools, not only to make something that works better, but to be a part of the conversation

Administrative interfaces at Cooper Hewitt (8)

Administrative Interfaces: What does success look like? How does it feel?

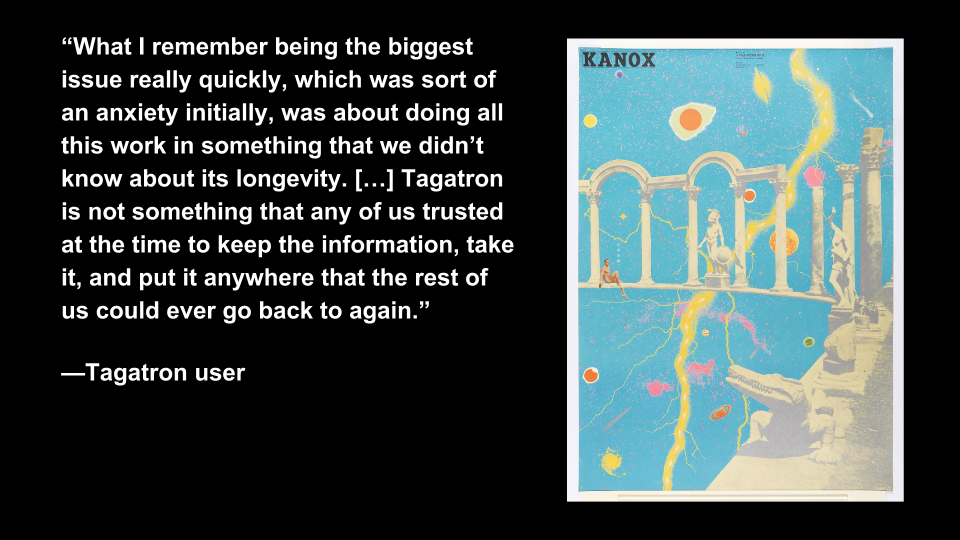
  • In informal interviews with Tagatron users we found trust to be a central theme of users’ response to the interface
  • Since Tagatron augments the curators’ use of TMS, they were less trusting of its database as a long-lasting data repository
  • Improving user feedback (like confirmation messages) helped build trust in the interface
  • Bill Moggridge, Designing Interaction: designing interaction is designing the relationship between people and things
  • We came to realize the responsibility of designing interfaces—validating and responding to users’ concerns; acknowledging the burden of new responsibilities
  • Administrative interfaces at the crux of the staff relationship to the new Cooper Hewitt experience
  • Anticipating issues in developing and maintaining administrative interfaces (when success feels like failure):
  • First, the human factor: being open to the feedback and creating an environment where the channels exist to communicate staff thoughts on the tool.
  • Second, the technical factor: being able to act on what you hear from staff and make the required changes to complete the feedback loop.
  • Our responsibility as facilitators of technology in the museum to hear and act on concerns.

Administrative interfaces at Cooper Hewitt-9

Questions to ask when starting an administrative application to anticipate issues and accommodate of feedback.

Question 1: To what degree should the (administrative) tool fit with pre-existing notions?

  • This question addresses the need to understand contextual use of the tool
  • Tagatron: curatorial culture around spreadsheets and TMS
  • Pen Pairing Station: this tool disrupted the expected ticket selling workflow. We learned the that the tool needed to make Pen Pairing as unobtrusive as possible

Administrative interfaces at Cooper Hewitt (10)

Question 2: How much of the underlying technology should come through to the interface?

  • Infrastructure & interfaces are layers of an onion—the best mental model for a tool’s interface might not reflect the best technical model for its back end
  • Tagatron: the filtering tools were a reflection of how data was stored in the database, not how curators expected it
  • Pen Pairing Station: error messages from all parts of the application stack came through to the user unaltered, this was not helpful to users
  • Highlights the need for a technical solution that allows for flexibility in the middle, “translation layer” of an application

Administrative interfaces at Cooper Hewitt (11)

Question 3: What kinds of feedback does the tool provide?

  • Feedback is the voice of the interface/ its personality–is it finicky or reliable? Annoying or supportive?
  • Tagatron: missing feedback created distrust
  • Pen Pairing: too much feedback caused confusion (error messages, validation handshake)
  • Our design and production methodology: working code always wins/ learning through doing; build small, working prototypes and continually iterate.
  • A more anticipatory form of design (like design thinking) could have helped us find answers to this question sooner

Administrative interfaces at Cooper Hewitt (12)

Question 4: Is it an appropriate time for experimentation?

  • Tagatron’s v1 included relatively unknown-to-us technology like MongoDB and nodejs. We should have used more familiar technology or done small-scale tests before implementing a project of this scale–it severely hindered our ability to accommodate feedback
  • Other tools we built that involved experimental tech were only successful because their scale and userbase were far smaller (label writer)

Administrative interfaces at Cooper Hewitt (13)

The result of everything: bridges, lines of communication opened

  • Building administrative tools for staff created cross-departmental conversation—in taking on the role of building and maintaining Tagatron and the Pen Pairing Station, the Digital & Emerging Media team engaged users from departments across the museum and observed closely how the tools fit into staff members’ larger roles

A Very Happy & Open Birthday for the Pen

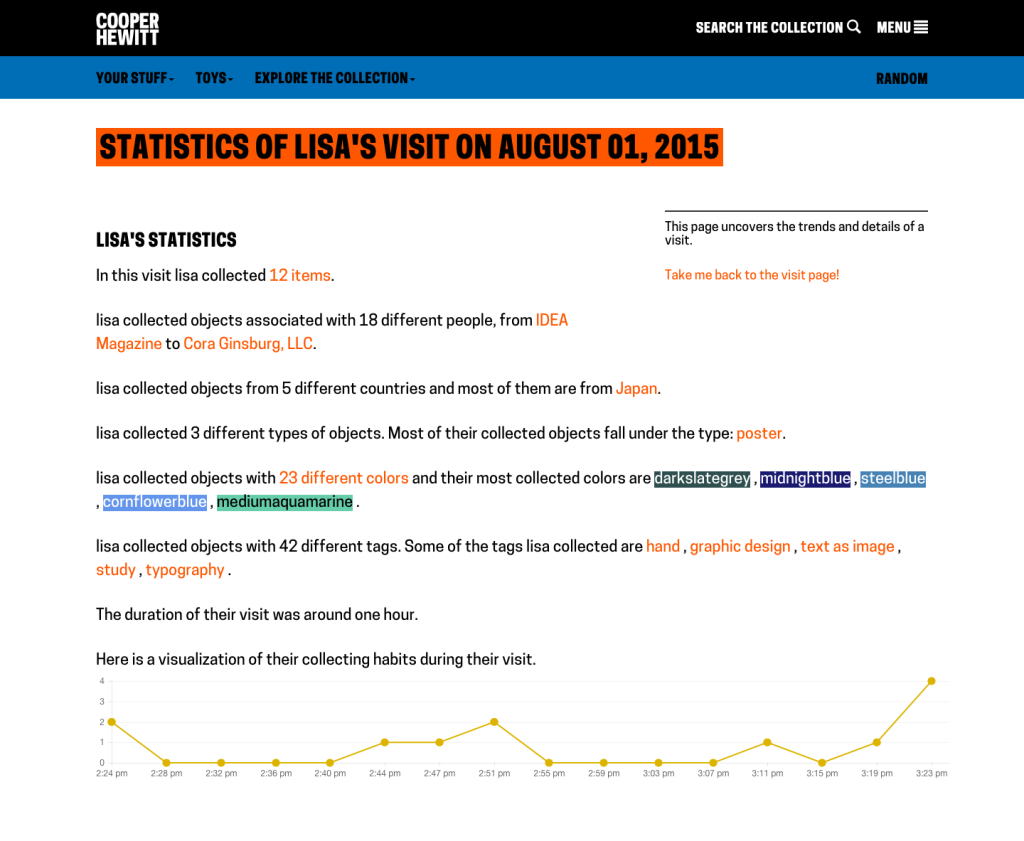
lisa-pen-table-pic

Today marks the first birthday of our beloved Pen. It’s been an amazing year, filled will many iterations, updates, and above all, visits! Today is a celebration of the Pen, but also of all of our amazing partners whose continued support have helped to make the Pen a reality. So I’d like to start with a special thank you first and foremost to Bloomberg Philanthropies for their generous support of our vision from the start, and to all of our team partners at Sistel Networks, GE, Undercurrent, Local Projects, and Tellart.

Updates

Over the course of the past year, we’ve been hard at work, making the Pen Experience at Cooper Hewitt the best it can be. Right after we launched the Pen, we immediately realized there was quite a bit of work to do behind the scenes so that our Visitor Experience staff could better deal with deploying the Pen, and so that our visitors have the best experience possible.

Here are some highlights:

Redesigning post-purchase touchpoints – We quickly realized that our ticket purchase flow needed to be better. This article goes over how we tried to make improvements so that visitors would have a more streamlined experience at the Visitor Experience desk and afterwards.

Exporting your visits – The idea of “downloading” your data seemed like an obvious necessity. It’s always nice to be able to “get all your stuff.” Aaron built a download tool that archives all the things you collected or created and packages it in a nice browser friendly format. (Affectionately known as parallel-visit)

Improving Back-of-House Interactions – We spent a lot of time behind the visitor services desk trying to understand where the pain points were. This is an ongoing effort, which we have iterated on numerous times over the year, but this post recounts the first major change we made, and it made all the difference.

Collecting all the things – We realized pretty quickly that visitors might want to extend their experience after they’ve visited, or more simply,  save things on our website. So we added the idea of a “shoebox” so that visitors to our website could save objects, just as if they had a Pen and were in our galleries.

Label Writer – In order to deploy and rotate new exhibitions and objects, Sam built an Android-based application that allows our exhibition staff to easily program our NFC based wall labels. This tool means any staff member can walk around with an Android device and reprogram any wall label using our API. Cool!

Improving visitor information with paper – Onboarding new visitors is a critical component. We’ve since iterated on this design, but the basic concept is still there–hand out postcards with visual information about how to use the Pen. It works.

Visual consistency – This has more to do with our collection’s website, but it applies to the Pen as well, in that it helps maintain a consistent look and feel for our visitors during their post visit. This was a major overhaul of the collections website that we think makes things much easier to understand and helps provide a more cohesive experience across all our digital and physical platforms.

Iterating the Post-Visit Experience – Another major improvement to our post-visit end of things. We changed the basic ticket design so that visitors would be more likely to find their way to their stuff, and we redesigned what it looks like when they get there.

Press and hold to save your visit – This is another experimental deployment where we are trying to find out if a new component of our visitor experience is helpful or confusing.

On Exhibitions and Iterations – Sam summarizes the rollout of a major exhibition and the changes we’ve had to make in order to cope with a complex exhibition.

Curating Exhibition Video for Digital Platforms – Lisa makes her Labs debut with this excellent article on how we are changing our video production workflow and what that means when someone collects an object in our galleries that contains video content.

The Big Numbers

Back in August we published some initial numbers. Here are the high level updates.

Here are some of the numbers we reported in August 2015:

  • March 10 to August 10 total number of times the Pen has been distributed – 62,015
  • March 10 to August 10 total objects collected – 1,394,030
  • March 10 to August 10 total visitor-made designs saved – 54,029
  • March 10 to August 10 mean zero collection rate – 26.7%
  • March 10 to August 10 mean time on campus – 99.56 minutes
  • March 10 to August 10 post visit website retrieval rate – 33.8%

And here are the latest numbers from March 10, 2015 through March 9, 2016

  • March 10, 2015 to March 9, 2016 total number of times the Pen has been distributed – 154,812
  • March 10, 2015 to March 9, 2016 total objects collected – 3,972,359
  • March 10, 2015 to March 9, 2016 total visitor-made designs saved – 122,655
  • March 10, 2015 to March 9, 2016 mean zero collection rate – 23.8%
  • March 10, 2015 to March 9, 2016 mean time on campus – 110.63 minutes
  • Feb 25, 2016 to March 9, 2016 post visit website retrieval rate – 28.02%

That last number is interesting. A few weeks ago we added some new code to our backend system to better track this data point. Previously we had relied on Google Analytics to tell us what percentage of visitors access their post visit website, but we found this to be pretty inaccurate. It didn’t account for multiple access to the same visit by multiple users (think social sharing of a visit) and so the number was typically higher than what we thought reflected reality.

So, we are now tracking a visit page’s “first access” in code and storing that value as a timestamp. This means we now have a very accurate picture of our post visit website retrieval rate and we are also able to easily tell how much time there is between the beginning of a visit and the first access of the visit website–currently at about 1 day and 10 hours on average.

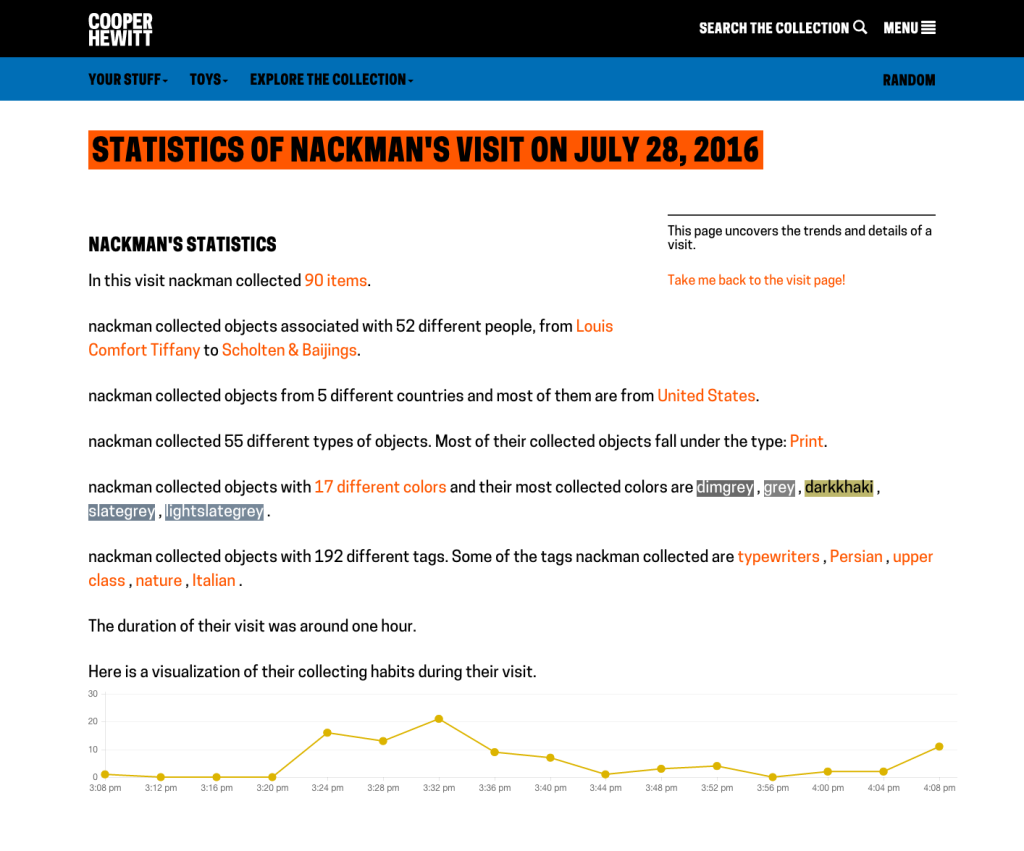
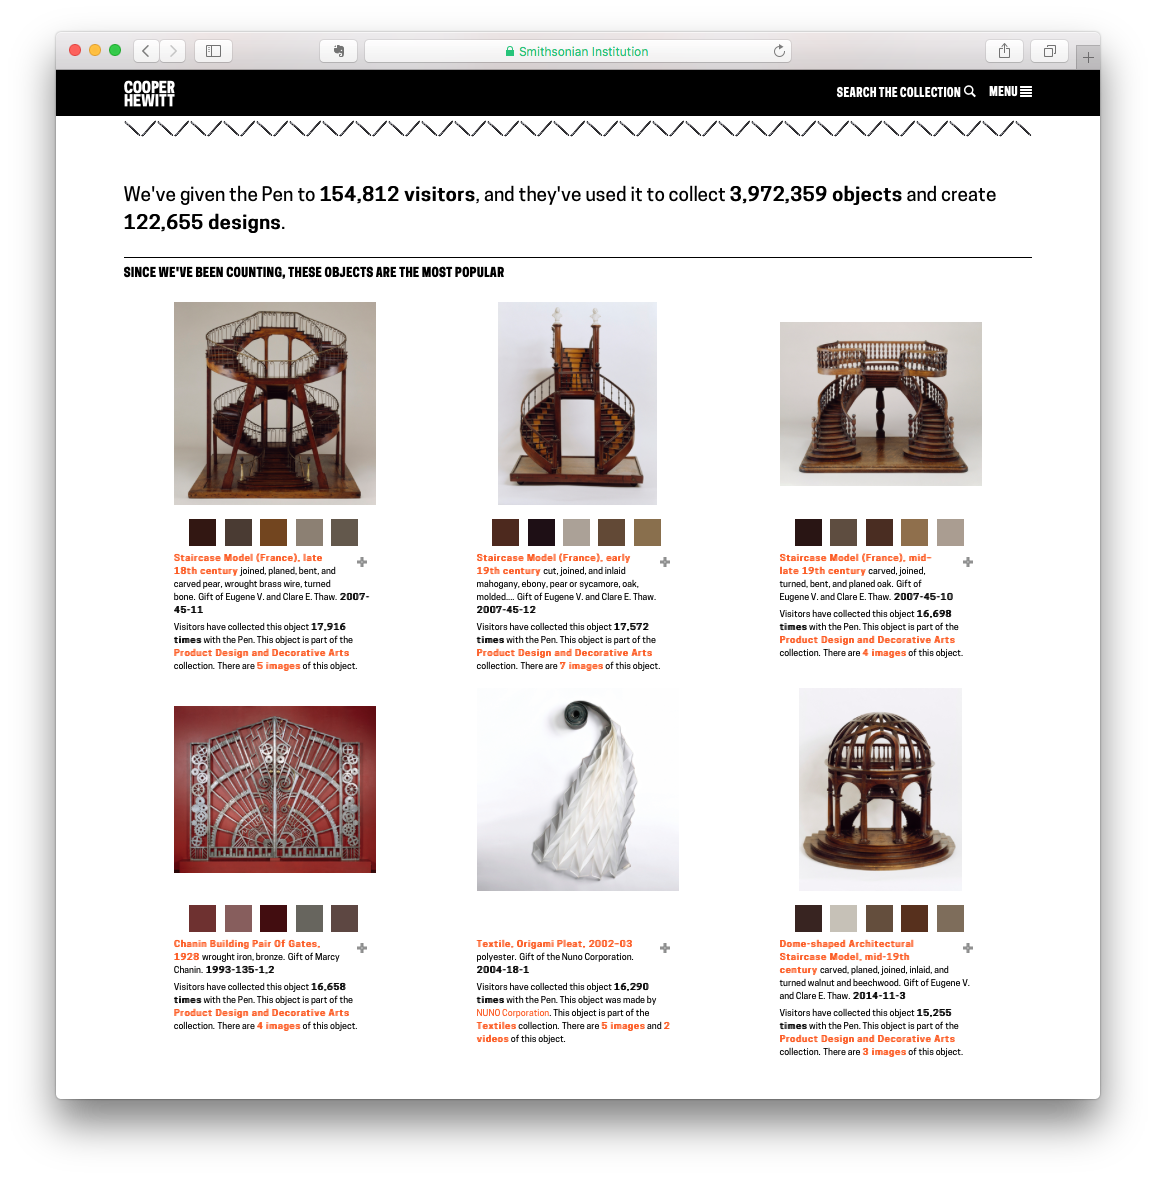
The Pen generates a massive amount of data. So, we decided to publish some of the higher level statistics on a public webpage which you can always check in on at https://collection.cooperhewitt.org/stats. This page reports daily and includes a few basic stats including a list of the most popular objects of all time. Yes, it’s the staircase models. They’ve been the frontrunners since we launched.

Those staircase models!

Those staircase models!

As you can see, we are just about to hit the 4 million objects collected mark. This is pretty significant and it means that our visitors on average have used the Pen to collect 26 objects per visit.

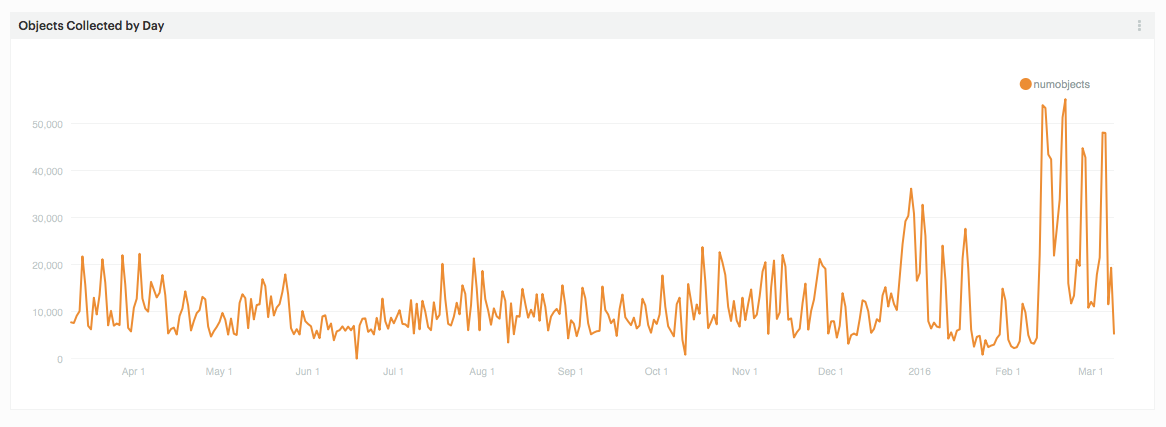
But it’s hard to gain a real sense of what’s going on if you just look at the high level numbers, so lets track some things over time. Below is a chart that shows objects collected by day for the last year.

Screen Shot 2016-03-09 at 3.50.36 PM

Objects collected by day since March 10, 2015

On the right you can easily see a big jump. This corresponds with the opening of the exhibition Beauty–Cooper Hewitt Design Triennial. It’s partly due to increased visitation following the opening, but what’s really going on here is a heavy use of object bundling. If you follow this blog, you’ll have recently read the post by Sam where he talks about the need to bundle many objects on one tag. This means that when a visitor taps his or her pen on a tag, they very often collect multiple objects. Beauty makes heavy use of this feature, bundling a dozen or so objects per tag in many cases and resulting in a dramatic increase in collected objects per day.

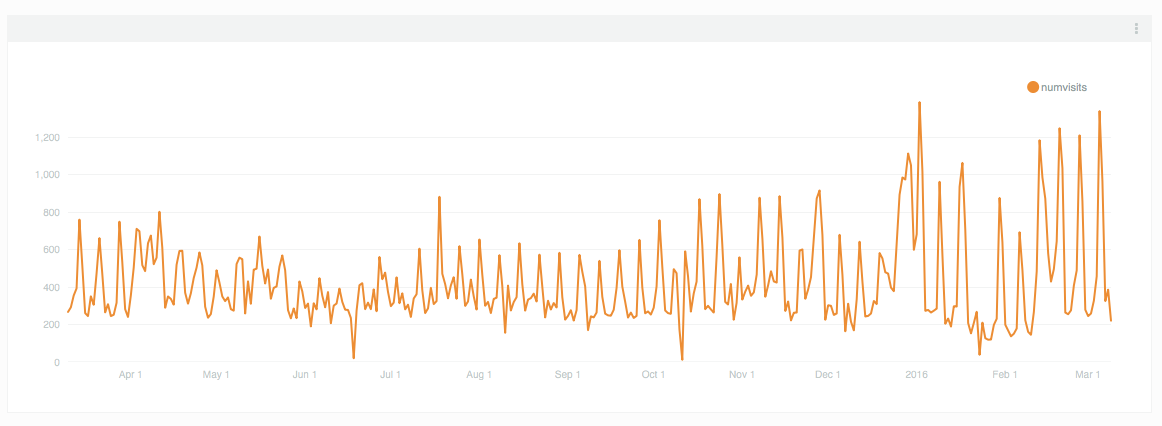
Pen checkouts per day since March 10, 2015

Pen checkouts per day since March 10, 2015

We can easily see that this, is in fact, what is happening if we look at our daily pen checkouts. Here we see a reasonable increase in checkouts following the launch of Beauty, but it’s not nearly as dramatic as the number of objects being collected each day.

Screen Shot 2016-03-09 at 11.40.09 PM

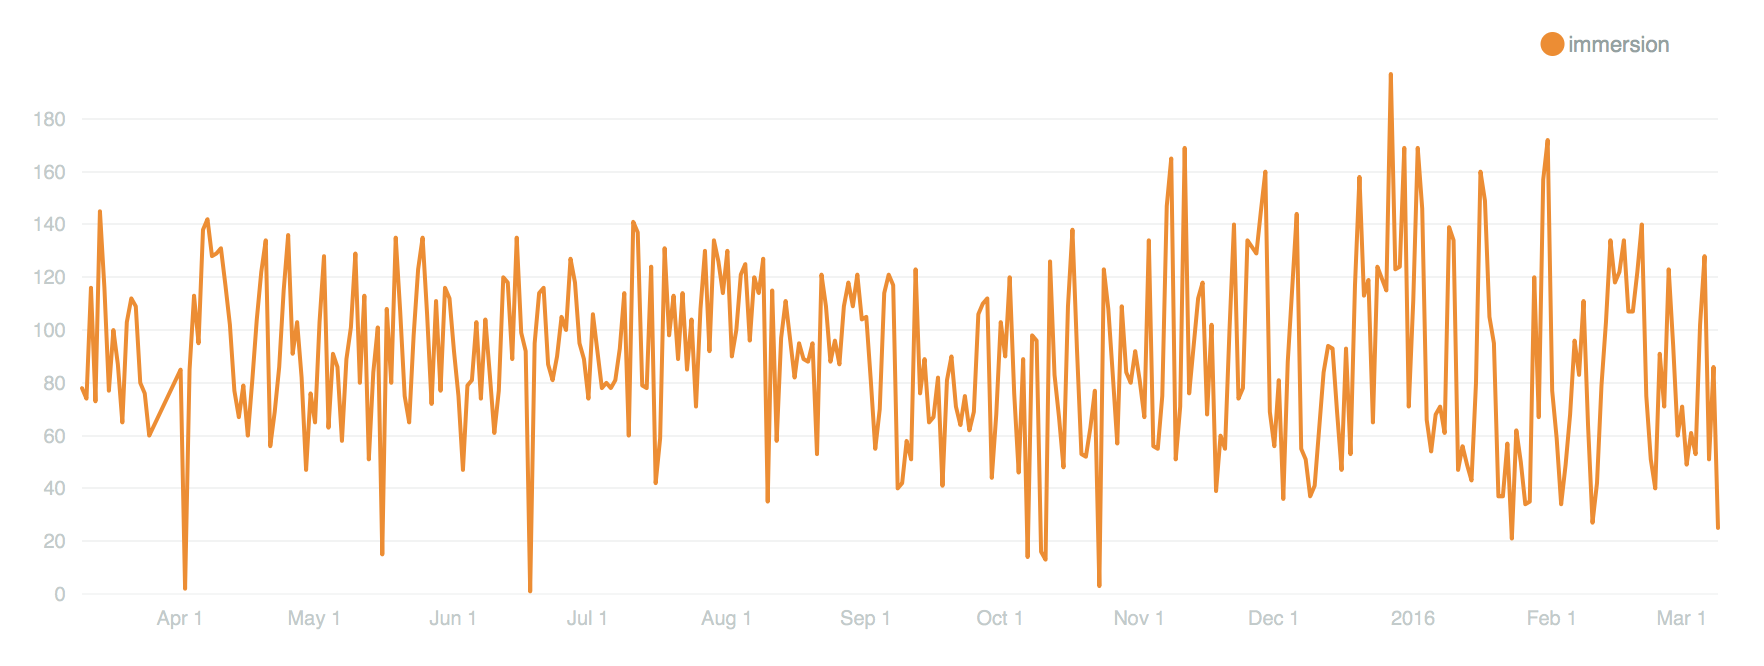
Immersion room creations by day since March 10, 2015

Above is a chart that shows how many designs were created in the immersion room each day over the past year. It’s also going to be directly connected to the number of visitors we have, but it’s interesting to see the mass of it along this period of time. The immersion room is one of our more popular interactive installations and it has been on view since we launched. So it’s not a big surprise it has a pretty steady curve to it. Also, keep in mind that this is only representative of “things saved” as we are not tracking the thousands of drawings that visitors make and walk away from.

We can slice and dice the Pen data all we want. I suppose we could take requests. But I have a better idea.

Open Data

Today we are opening up the Pen Data. This means a number of things, so listen closely.

  1. The data we are releasing is an anonymized and obfuscated version of some of the actual data.
  2. If you saved your visit to an account within thirty days of this post (and future data updates) we won’t include your data in this public release.
  3. This data is being licensed under Creative Commons – Attribution, Non-Commercial. This means a company can’t use this data for commercial purposes.
  4. The data we are releasing today is meant to be used in conjunction with out public domain collection metadata or our public API.

The data we are releasing is meant to facilitate the development of an understanding of Cooper Hewitt, its collection and interactive experiences. The idea here is that designers, artists, researchers and data analysts will have easy access to the data generated by the Pen and will be able to analyze  and create data visualizations so that we can better understand the impact our in-gallery technology has on visitors.

We believe there is a lot more going on in our galleries than we might currently understand. Visitors are spending incredible amounts of time at our interactive tables, and have been using the Pen in ways we hadn’t originally thought of. For example, we know that some visitors (children especial) try to collect every single object on view. We call these our treasure hunters. We also know that a percentage of our visitors take a pen and don’t use it to collect anything at all, though they tend to use the stylus end quite a bit. Through careful analysis of this kind of data, we believe that we will be able to begin to uncover new behavior patterns and aspects of “collecting” we haven’t yet discovered.

If you fit this category and are curious enough to take our data for a spin, please get in touch, we’d love to see what you create!

On Exhibitions and Iterations

Since reopening in December 2014, we’ve found that the coming opening of an exhibition is a big driver of iteration. The work involved in preparing an exhibition involves the whole museum and is one of the most coordinated and planned-out things we do, and because of this, new exhibitions push us to improve in a number of ways.

First, new exhibitions can highlight existing gaps or inefficiencies in our systems. Our tagging tool, for example, always sees a round of bug fixes or new features before an exhibition because it coincides with a time when it will see heavy use. Second, exhibitions present us with new technical challenges. Objects in the Heatherwick exhibition, for example, were displayed in the galleries grouped into “projects,” which is also how we wanted users to collect them with their Pens and view them on the website. To accomplish this we had to figure out a way that TMS, our collections management software, could store both the individual objects (for internal purposes) and the grouped projects (which would hold all the public-facing images and text), and figure out how to see that through to the website in a way that made registrars, curators and ourselves comfortable. Finally, a new exhibition can present an opportunity for experimentation. David Adjaye Selects gave us the opportunity to scale up Object Phone, a telephone-based riff on the audio guide, which originally started as a small, rough prototype.

Last week was the opening of our triennial exhibition “Beauty,” which similarly presented us with a number of technical challenges and opportunities to experiment. In this post I’ll share some of those challenges and the work we did to approach them.

Collecting Exhibition Text

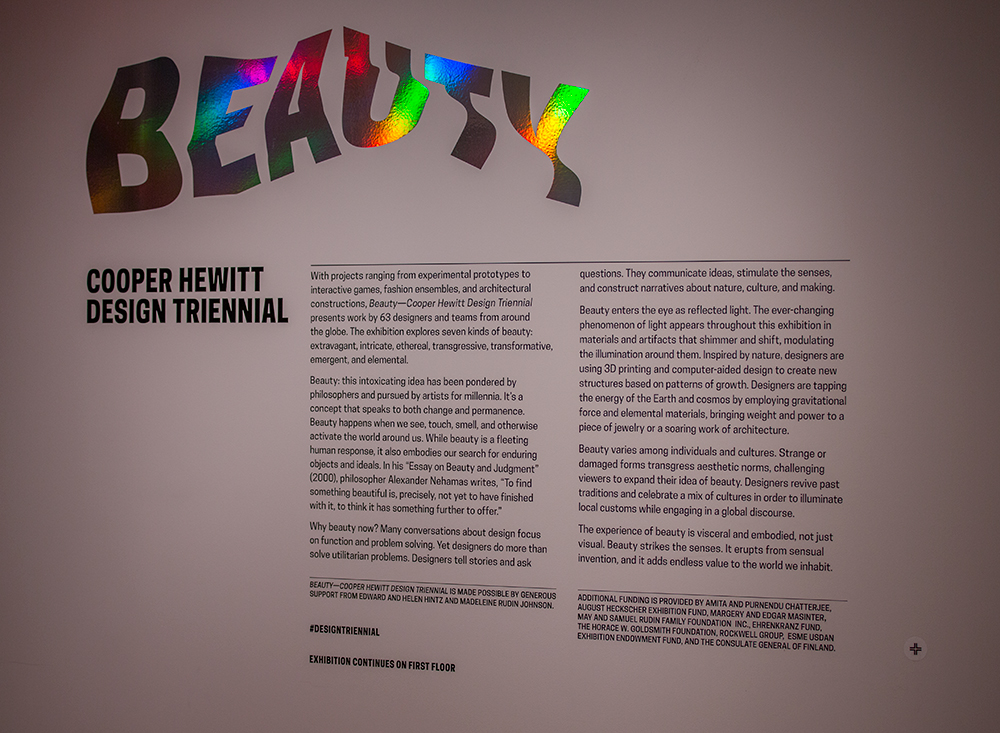
Triennial's wall text, with the collect icon in the lower-right corner

Triennial’s wall text, with the collect icon in the lower-right corner

Since the beginning of the pen project we’ve been saying that the Pens don’t just have to collect objects. Aaron and Seb wrote in their paper on the project that “nothing would prevent the museum from allowing visitors to ‘collect’ individual designers, entire exhibitions or even architectural elements from the building itself in the future.” To that end, we’ve experimented with collecting shop items and decided that with the triennial we would allow visitors to collect exhibition text as well.

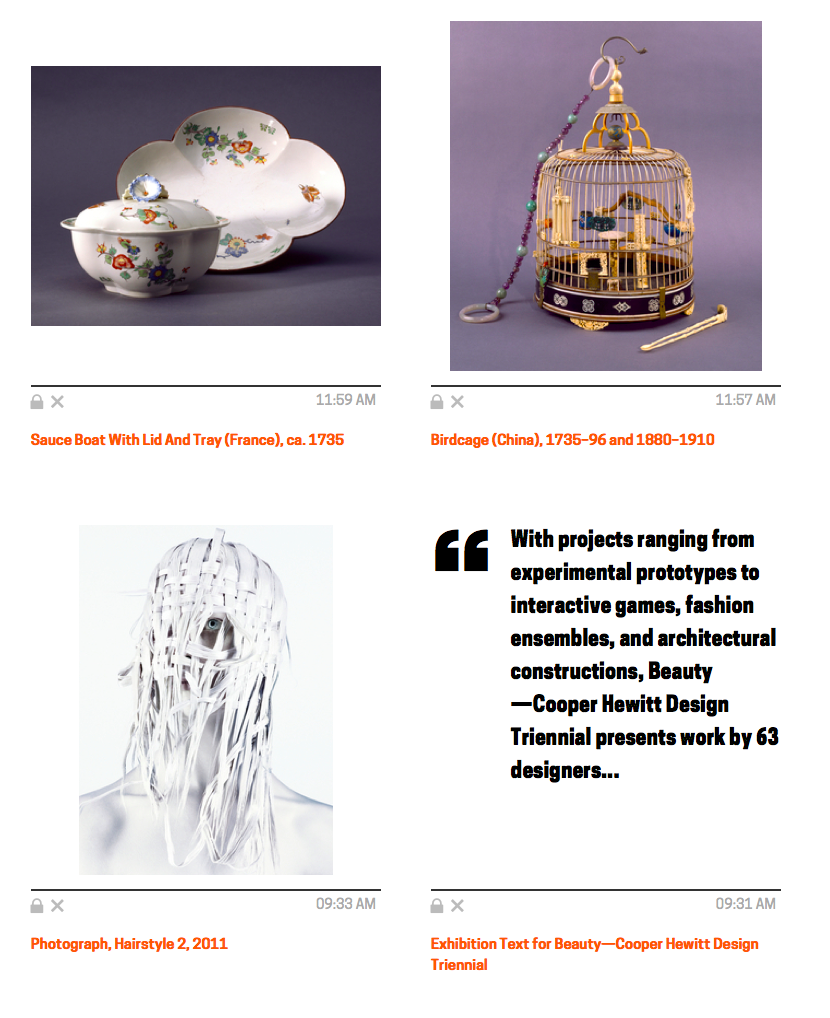
Exhibition text (in museum argot, “A-Panel” is the main text at the beginning of an exhibition and “B-Panel” are any additional texts you might find along the way) makes total sense as something that a visitor should be able to remember for later. It explains and contextualizes an exhibition’s goals, contents and organization. We’ve had the text on our collections since we reopened but it took a few clicks to get through from a visitor’s post-visit website. Now, the text will be right there alongside all of a visitor’s objects.

The exhibition text on a post-visit website

The exhibition text on a post-visit website

The open-ended part of this is what visitors will expect when they collect an “exhibition.” We installed the collection points with no helper text, i.e. it doesn’t say “press here to collect this exhibition’s text.” We think it’s clear that the crosshairs refer to the text, but one of our original ideas was that we could have a way for the visitor to automatically collect every object in the exhibition and I wonder if that might be the implied function of the text tag. We will have to observe and adapt accordingly on that point.

Videos Instead of Images

When we first added videos to our collections site, we found that the fastest way to accomplish what we needed was to use TMS for relating videos to objects but use custom software for the formatting and uploading of the videos. We generate four versions of every video file — subtitled and not subtitled at two resolutions each — which we use in the galleries, on the tables and on the website. One of the weaknesses of this pipeline is that because the videos don’t live in the usual asset repository the way all of our images do, the link between TMS and the actual file’s location is made by nothing more than a “magic string” and a bit of guesswork. This makes it difficult to work with the video records in TMS: users get no preview and it can be difficult to know which video ID refers to which specific video. All of this is something we’ll be taking another look at in the near future, but there is one small chunk of this problem we approached in advance of the Triennial: how to make our website show the video in place of the primary image if it would be more appropriate to do so.

Here’s an example. Daniel Brown’s On Growth and Form is an animation on display in the Triennial. Before, it would have looked like this — the primary image is a still rendering that has been added in TMS, and the video appears as related content further down the page.

growthandform

What we did is to say if the object is itself a video, animation or other screen-based media and we have an associated video record linked to the object, remove the primary image and put the video there instead. That looks like this:

Screen Shot 2016-02-16 at 3.33.50 PM

Like all good iterations, this one opened up a bunch of next steps. First, we need to figure out how to add videos into our main digital asset pipeline so that the guesswork can be removed from picking primary videos and a curator or image specialist can select it as “primary” the same way they would do with an image. Next, it brought up an item that’s been on the backburner for a while, which is a better way to display alternate images of an object. Currently, they have their own page, which gets the job done, but it would be nice to present some alternate views on the main object page as well.

Just a Reflektor Sandbox

It's fun!

It’s fun!

We had a great opportunity to do some experimentation on our collections site due to the inclusion of Aaron Koblin and Vincent Morisset’s interactive video for Arcade Fire’s Just a Reflektor. The project’s source code is already available online and contains a “sandbox” environment, a tool that demonstrates some of the interactive visual effects created for the music video in a fun, open-ended environment. We were able to quickly adapt the sandbox’s source code to fit on our collections site so that visitors who collect the video with their Pen will be able to explore a more barebones version of the final interactive piece. You can check that out here.

Fully Loaded Labels

When we were working on the Pen prototypes, we tried six different NFC tags before getting to the one that met all of our requirements. We ended up with these NTAG203 tags whose combination of size and antenna design made them work well with our Pens and our wall labels. Their onboard memory of 144 bytes, combined with the system we devised for encoding collection data on them, meant that we could store a maximum of 11 objects on a tag. Of course we didn’t see that ever being a problem… until it was. The labels in the triennial exhibition are grouped by designer, not by object, and in some cases we have 35 objects from a designer on display that all need to be collected with one Pen press. There were two solutions: find tags with more memory (aka “throw more hardware at it”) or figure out a new way to encode the tags using fewer bytes and update the codebase to support both the new and old ways (aka “maintenance nightmare”). Fortunately for us, the NTAG216 series of tags have become more commonly available in the past year, which feature 888 bytes of memory, enough for around 70 objects on a tag. After a few rounds of end-to-end testing (writing the tag, collecting it with a pen and having it show up on the post-visit website), we rolled the new tags out to the galleries for the dozen or so “high capacity” labels.

The new tag (smaller, on the left) and the old tag (right)

The new tag (smaller, on the left) and the old tag (right)

The most interesting iteration that’s been made overall, I think, is how our exhibition workflow has changed over time to accommodate the Pen. With each new exhibition, we take what sneaked up on us the last time and try to anticipate it. As the most recent exhibition, Beauty’s timeline included more digitally-focused milestones from the outset than any other exhibition yet. Not only did this allow us to anticipate the tag capacity issue many months in advance, but it also gave us more time to double check and fix small problems in the days before opening and gave us more time to try new, experimental approaches to the collections website and post-visit experience. We’re all excited to keep this momentum going as work ramps up on the next exhibitions!