Category Archives: Digitization

Making ‘Dive into Color’

Guest post by Olivia Vane

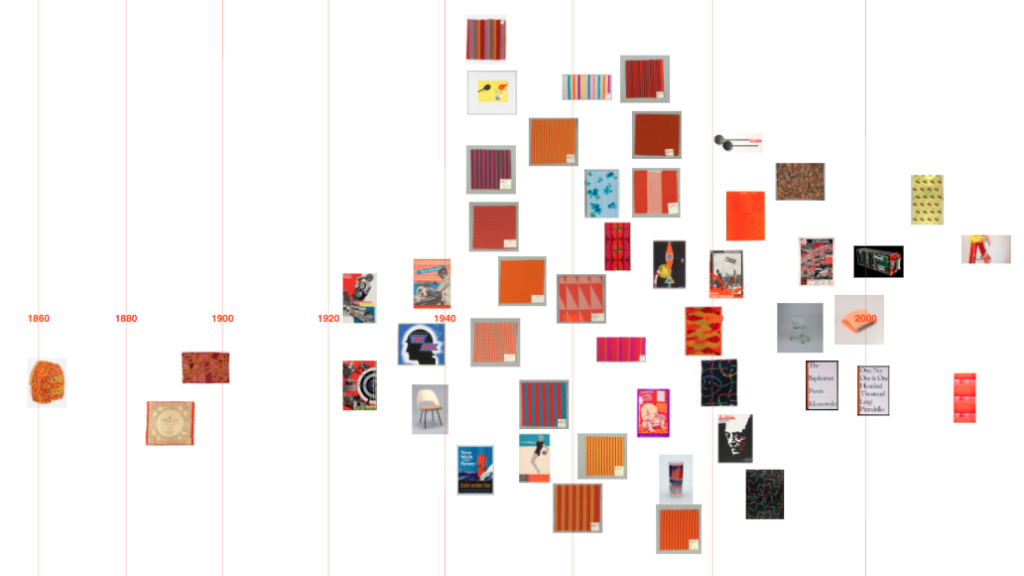
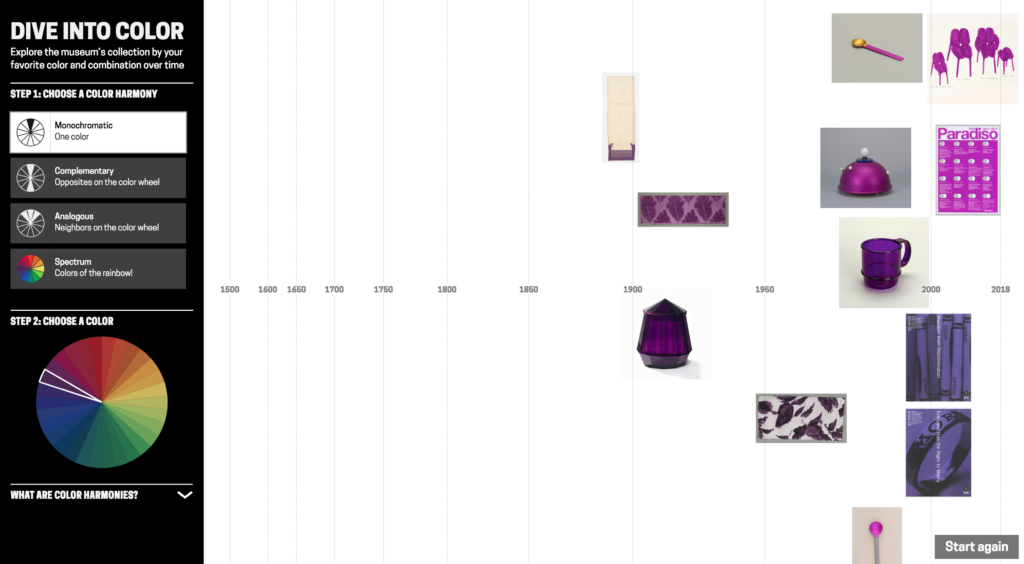
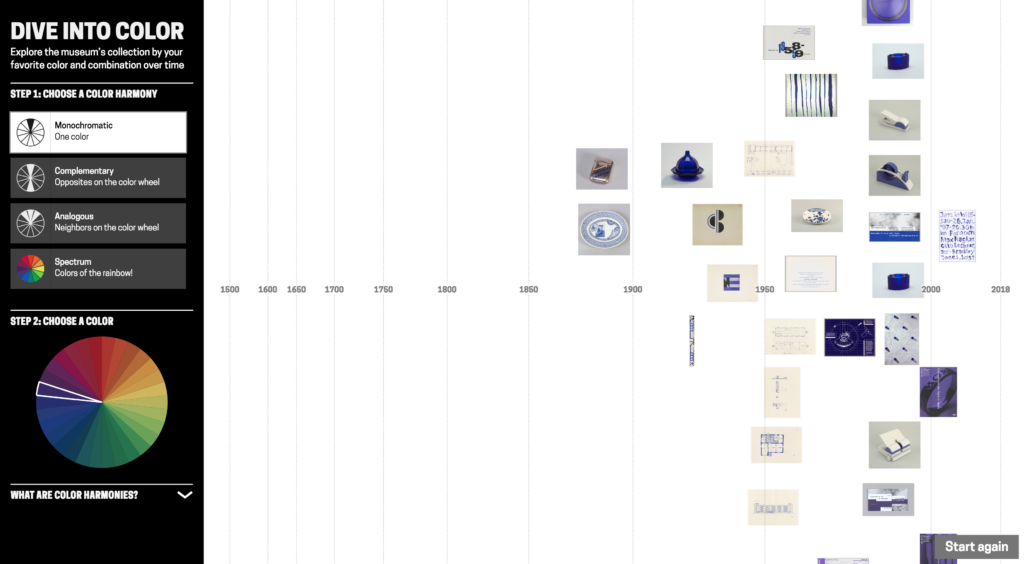
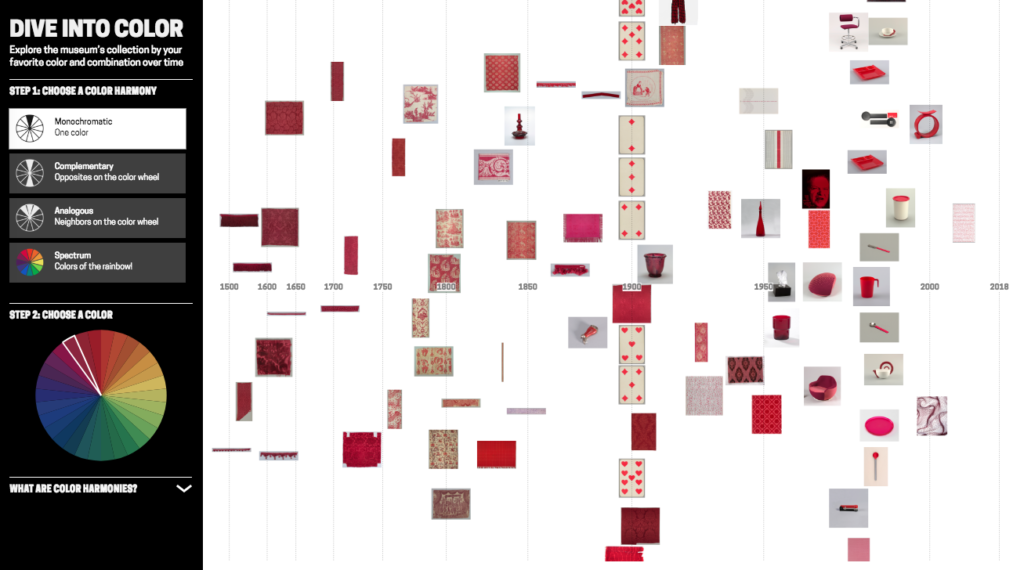
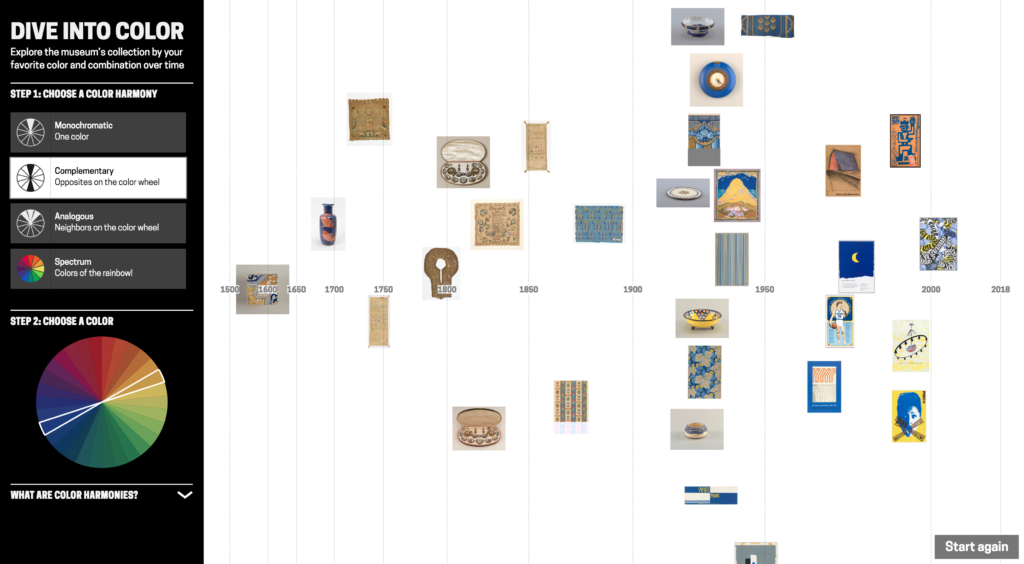
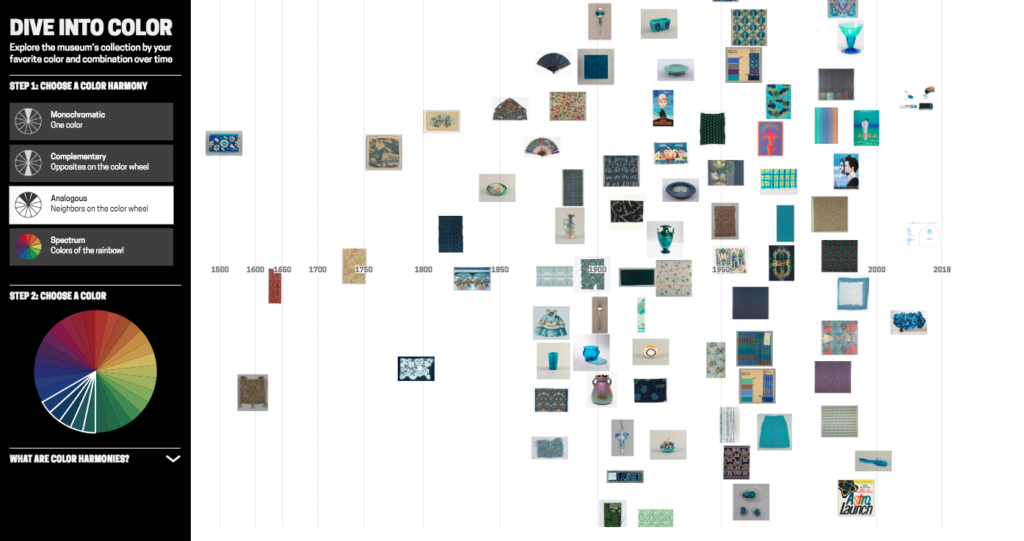
‘Dive into Color’ is an interactive timeline for exploring the Cooper Hewitt collection by colour/colour harmony and time. It is exhibited in ‘Saturated: The Allure and Science of Color’ 11 May 2018 – 13 Jan 2019.

Since spending time at Cooper Hewitt last year on a fellowship, I returned to London where I’m a PhD student at Royal College of Art (RCA) in Innovation Design Engineering supervised by Professor Stephen Boyd Davis. At Cooper Hewitt, I developed a prototype timeline tool for visualising the museum collection by tags.

This post describes further work on that prototype, shifting the tool to exploring the collection by colour. As a curator explained: “[visualising by] colour, I think, is useful for the purposes of the study of the taste for different colours, but it’s also a more interesting exercise for the public just to be able to do and get pleasure out of.” Colour is enjoyable – it’s eye-catching and vibrant – and it offers a visual, intuitive way to explore a digitised collection without needing specialist knowledge. With a design collection like Cooper Hewitt’s, tracing colour through history is also interesting for looking at fashions and innovation in colour technology.

I’ve been asked a few times recently what my process is for designing visualisations. So in this post I’m going to step though the early prototypes and retrace my design decisions. Along the way, I will talk over practical points for working with colour (and colour harmonies!) in collection data, and working between digital and artist colour systems.

Previous colour-collections visualisations
Colour has previously been used both as a facet for search and for visualising collections. Geoff Hinchcliffe’s ‘Tate Explorer’ offers colour as a search facet paired with a timeline. This prototype from the Swedish National Heritage Board (write-up forthcoming) combines colours and tags for exploring a fashion collection. Richard Barrett-Small’s ‘ColourLens’ searches over Rijksmuseum and Walters Art Museum data by colour with a graphic for each item visualising its colour proportions. And Google Arts & Culture’s ‘Art Palette’ is a search engine that finds artworks based on a chosen colour palette.

Collections visualised by colour include the Library of Congress, where Laura Wrubel created this tool for overviewing the colour palettes of objects over a collection and Jer Thorp visualised the colour names present in the titles of works. Also using Cooper Hewitt data, Rubén Abad created this visualisation of the colours present by decade in Cooper Hewitt’s objects. Lev Manovich has visualised artworks, for example Mondrian and Rothko paintings, by colour characteristics including hue and saturation. Everardo Reyes visualised Paul Klee’s paintings by hue. And Brian Foo’s visualisation of the New York Public Library digitised collection has an option to organise items by colour.

I was interested to explore colour alongside the time dimension. And since Cooper Hewitt was preparing for an exhibition, ‘Saturated’, focusing on colour theory and design, I was intrigued to see if I could trace colour harmonies across the collection.

Colour harmonies are combinations of colours that are pleasing to the eye. The relative positions of colours in a colour wheel can be used to describe different harmonies like complementary colours (opposites on the colour wheel), or analogous colours (neighbours on the colour wheel). Artists and designers create different visual effects and contrasts with different harmony types.
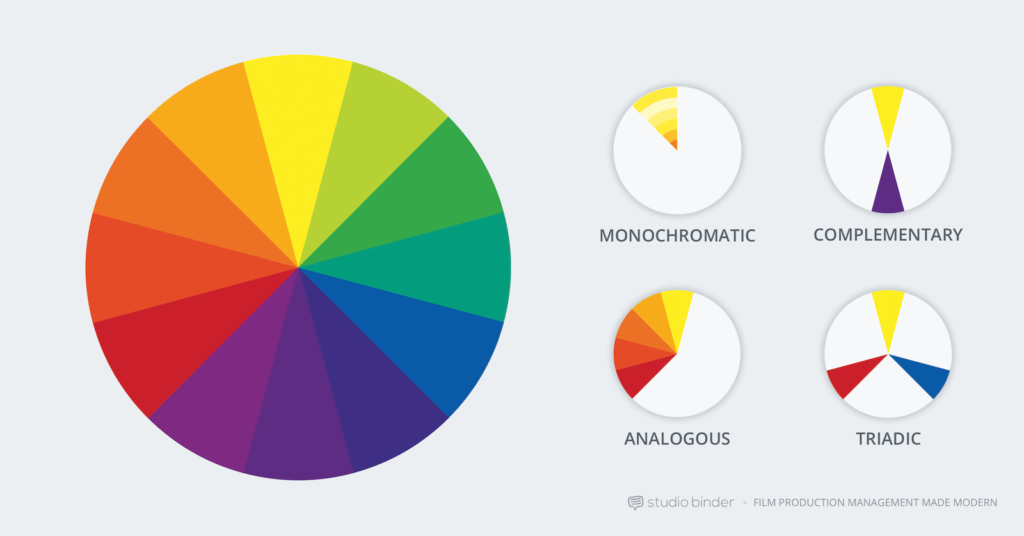
Colour harmony examples, image from studiobinder

Extracting colours across the Cooper Hewitt collection
It’s already possible to search by colour on Cooper Hewitt’s collection site. Colour data was extracted using Giv Parvaneh’s great tool RoyGBiv (described in this Cooper Hewitt Labs post). Roughly, RoyGBiv works by checking the colour value of each pixel in an image, clustering colour values that are similar enough to be considered the same and returning up to 5 dominant colours in an image.

The colours extracted from Cooper Hewitt’s collection with RoyGBiv are good on the whole, but errors sometimes occur. The background colour is sometimes picked up. The effect of light and shadow on a 3D object can introduce multiple, illusory colours:

As always there are quirks working with digitised collections, like these Dutch tiles which had coloured stickers on them when they were photographed:

Or lace photographed against a dark background for contrast:

Since the possible number of unique colours extracted across the collection is huge, searching by colour on the Cooper Hewitt website is simplified by snapping extracted colours to the closest value in a standardised palette (the default is the CSS4 web colour palette, but the CSS3 and Crayola palettes are also options). On the Cooper Hewitt website, you can search the collection by 116 CSS4 colours. Both the original and ‘snapped to’ colour palettes are available in the Cooper Hewitt data – all stored as hex codes (six hexadecimal digits representing the levels of red, green and blue).

Prototyping
As a first step, I adapted my code to visualise collection items matching a CSS4 colour on a timeline (see visualisations below).

Although Cooper Hewitt has an API (an Application Programming Interface: a way for someone to make use of Cooper Hewitt’s data through a set of pre-defined requests made over the web), there is no method for returning all the objects matching a colour. Instead, I used collection data Cooper Hewitt had put on GitHub – an argument for institutions to offer both!

‘Orangered’

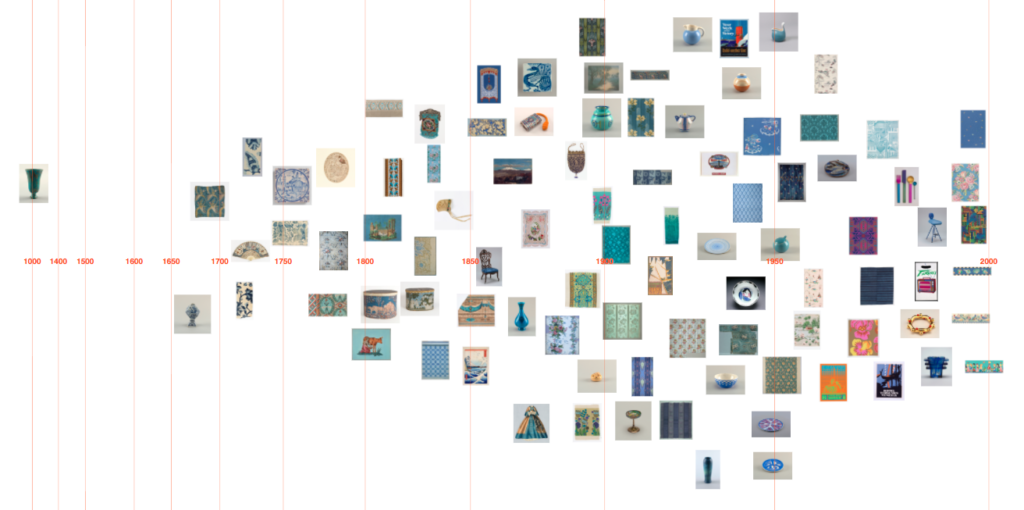
‘Steelblue’

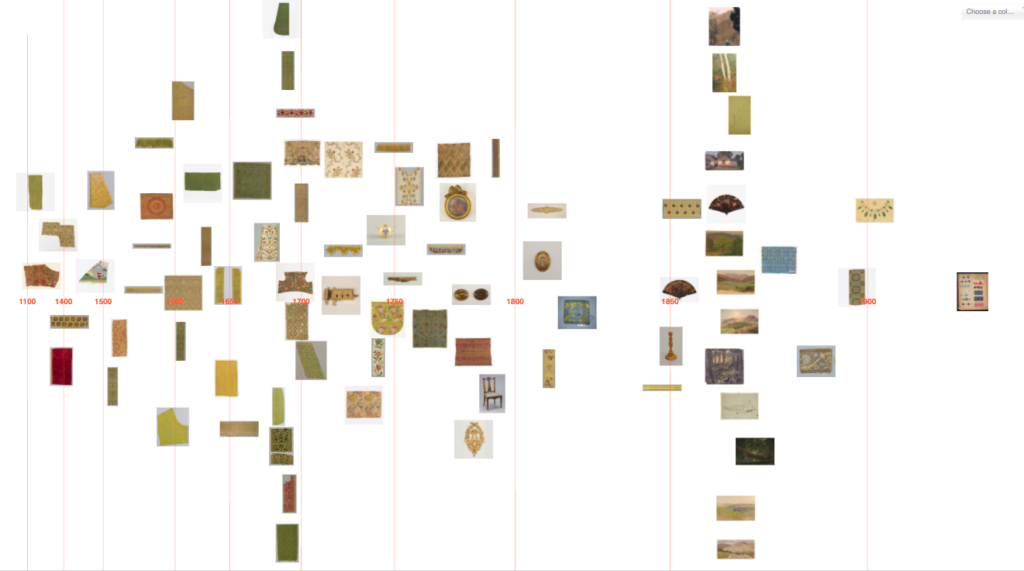
‘Olivedrab’

I then started exploring how I might visualise objects featuring a colour harmony, first trying complementary colours (opposites on the colour wheel).

I initially tried to do this by matching a chosen CSS4 colour with the nearest CSS4 colour of opposite hue. The HSL and HSV (hue, saturation, lightness/value) colour systems define hue as an angle round a circle (0-360°), so I inverted hues by converting hex codes to HSL. The visualised results were unsatisfying though, as often the search failed to find any matches. This doesn’t mean to say there was a lack of objects with complementary colours, but that my search was too precise (and artificially precise since which CSS4 palette colours you can consider to be complementary is fuzzy, and the colour data is imprecise anyway e.g. the illusory colours extracted for 3D objects).

I tried extending the reach of my search to matching several colours close to the inverted hue, but it felt very frustrating not to have a visual reference to the range of colours in a region and what colours were being searched over.

So I started experimenting with using a colour wheel input as a way to pick colour combinations and simultaneously see possible hue relations. I first tried mapping the colours from the standardised palettes by HSL round a circle.
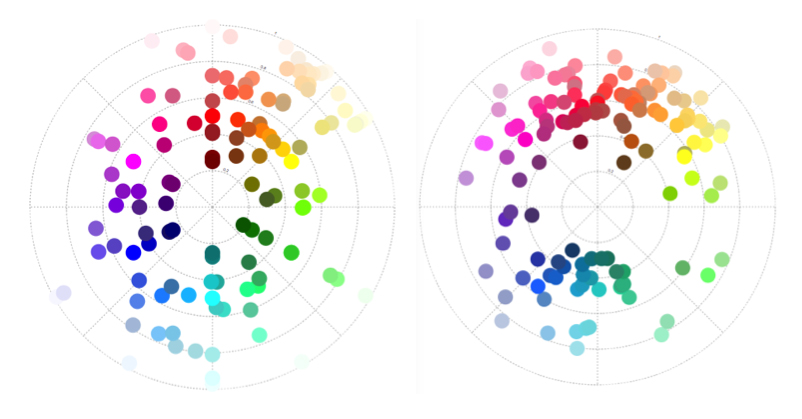
‘Snapped to’ colours in the Cooper Hewitt collection. CSS4 (left) and Crayola (right) palettes mapped by hue (in HSL). Angle = hue, radius = lightness.

And to make it easier to see the possible colours, I wrote some code to map the CSS4 palette colours to a wheel.

CSS4 palette colours → mapped round a wheel. Hue (HSL) = angle, ordered by lightness

I realised at this point, though, that the resulting design doesn’t match a typical artist’s/pigment colour wheel (which has red, yellow, blue – RYB – primary colours). HSL is a simple transformation of RGB colour space, and therefore the wheel has red, green, blue primaries. If this colour wheel is used to search over design artefacts, surely it would be more appropriate to use a design closer to the norm for artists and designers? (These in-depth articles by David Briggs – part 1, part 2 – explain the differences between traditional and modern colour theory, and colour training for artists).

There is no ‘correct’ colour wheel to adopt, but converting my HSL colour wheel to something closer to an artist’s version (using code from Ben Knight’s implementation of Adobe’s ‘Kuler’ colour wheel) felt like a reasonable compromise here.

(Left) Colours mapped by hue (HSL). Angle = hue, radius = lightness. (Right) Colour mapping adjusted to more closely resemble an artist’s colour wheel.

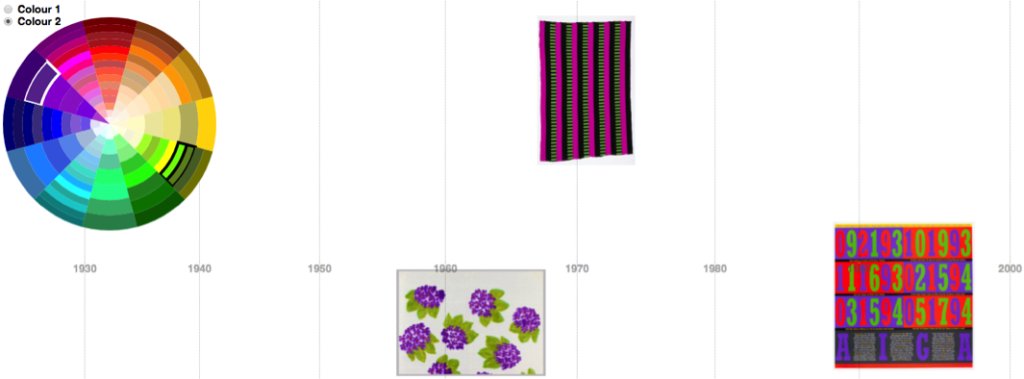
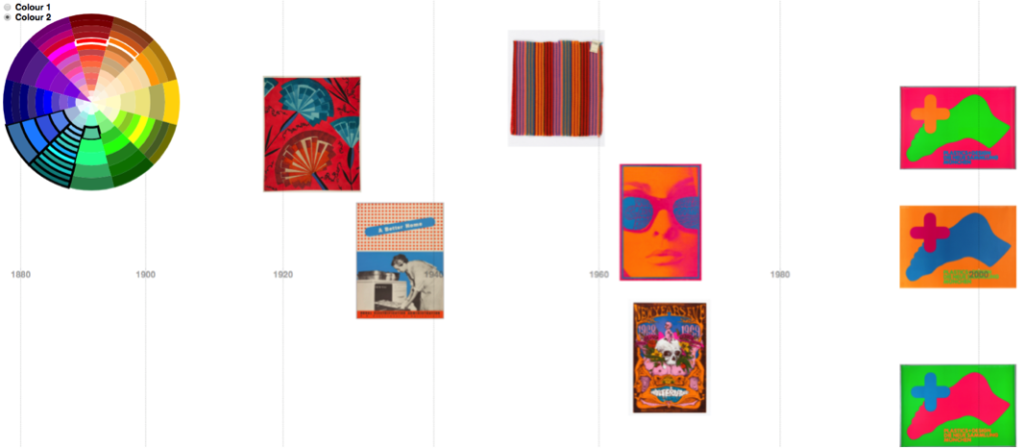
Using this colour wheel as a guide and an input, I could see and choose which colours to query. By searching over multiple colours, the visualised results were better. (In the images below, white and black borders around tiles in the colour wheel indicate the searched-over colour combinations):

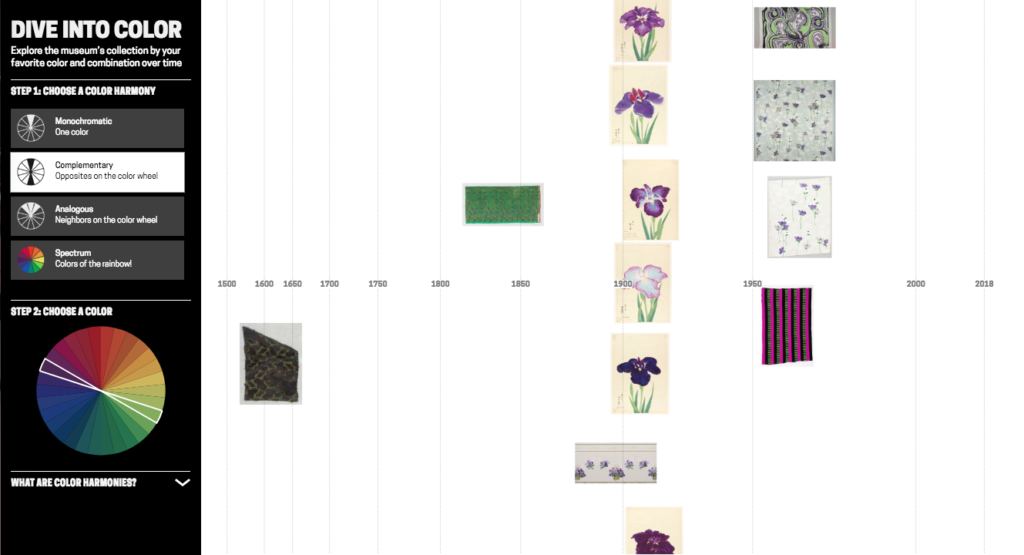
Purple against olive timeline

Orangered against cyan/blue timeline

Querying against colour data in HSV
While the results looked better with this prototype, the user interface is a mess and complicated to use. And the search query was not excluding objects that featured other colours in addition to the searched colour combination.

Sticking with the CSS4 palette was greatly complicating the task, so I abandoned using it. I converted all the original extracted colours (not ‘snapped’) from hex codes to HSV and created my own Elasticsearch index with the HSV colours stored as a nested datatype. This way I can: search over a hue range, with a threshold on saturation and value; exclude objects also featuring other hues; and it is simple to define more complex colour harmony searches (e.g. analogous, triadic, quadratic and split complementary).

Different colour harmonies tried in prototyping

Colour wheel graphic for objects
As a by-product, I realised I could repurpose my code to map individual object palettes round a colour wheel too. Thus, you get a compact graphic describing the colour relationships present in a single design. This is a nice example of the serendipity of designing, where you identify new possibilities as a result of seeing what you have already made.


(Above) Object with colour palette, (below) palette mapped to a wheel: easy to see complementary harmony


Colour wheel graphic examples

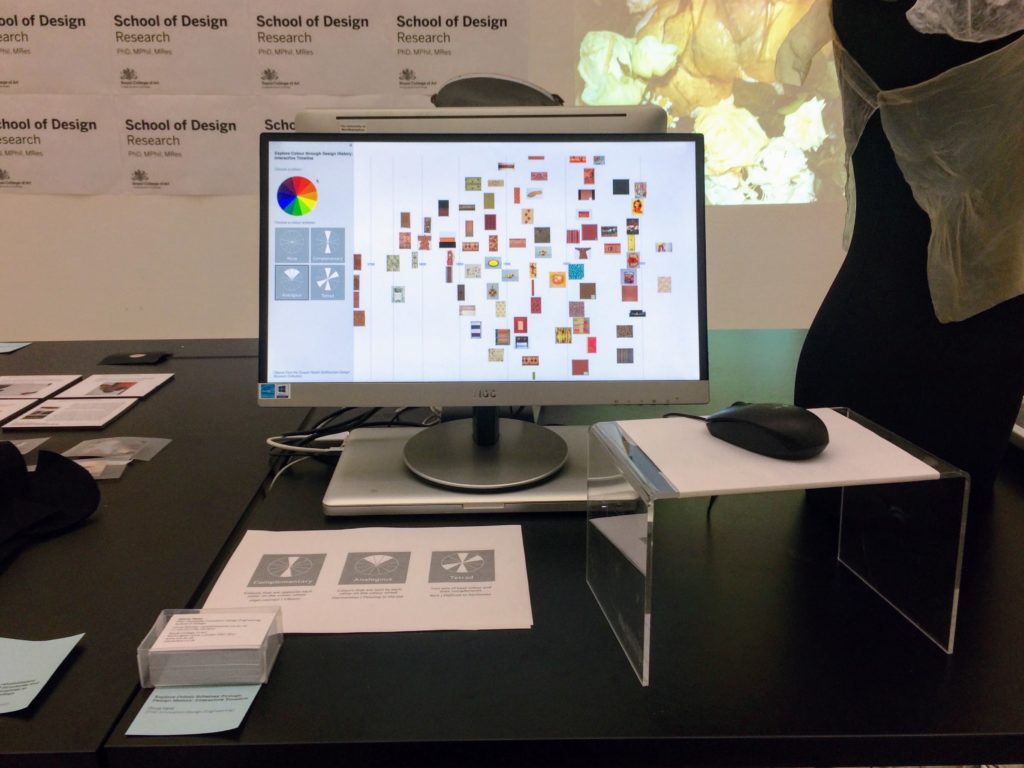
I adapted a simple artist’s (RYB) colour wheel to use as an input and tested the prototype with visitors at Royal College of Art’s January 2018 ‘Work in Progress’ show.

Testing the prototype with visitors at Royal College of Art’s Jan 2018 ‘Work in Progress’ show

In order to avoid reducing the size of the images (so it’s still possible to see what the objects are), I’ve capped the number of visualised objects to the 100 most saturated in colour.

There were few hits for the more complex harmonies (quadratic, tetradic, split complementary) and the results felt less convincing. I had widened the hue range to search over in order to increase the small number of hits, so the results were less visually cohesive anyway. And, in conversations with the museum curators, we decided to drop these more complex harmonies from the interface.

As mentioned earlier, there are some errors in the colour data. At this stage, since this setup only allows a fixed set of possible searches, with repeatable results, it was worth it for me to do some manual editing of the colour data to remove obvious errors.

Final interface design
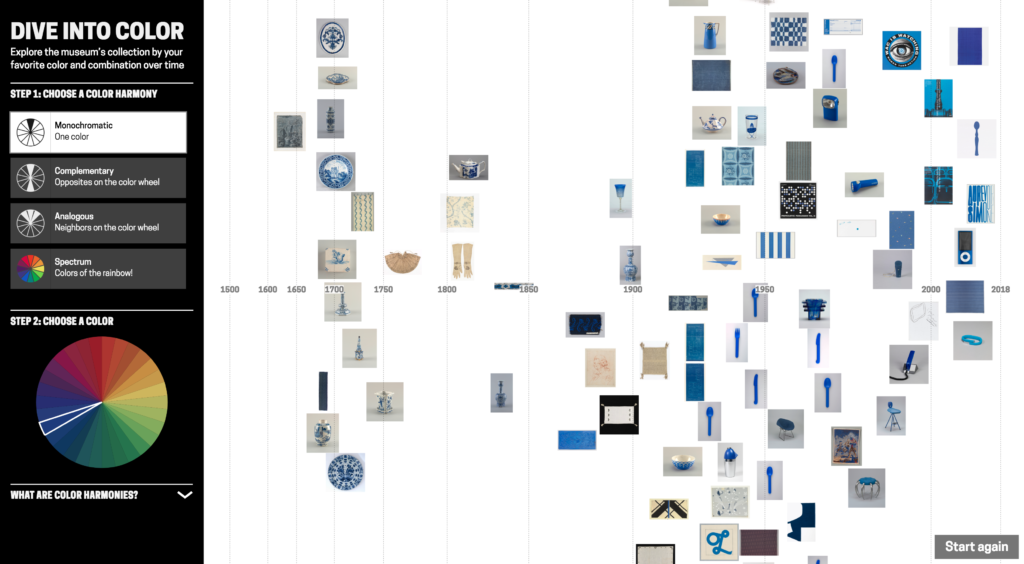
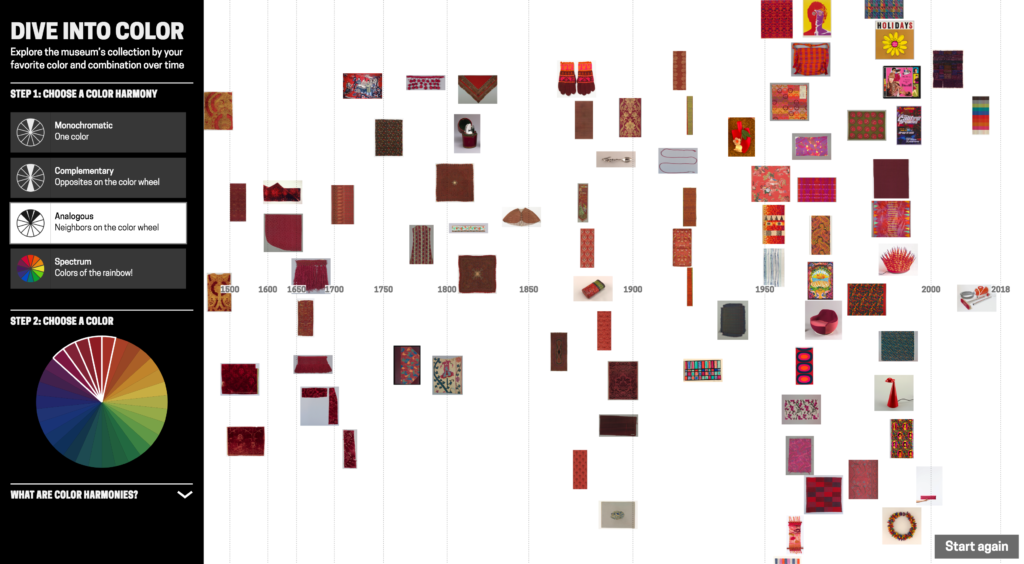
For the final (more polished!) interface design, which is now on display, I set on adopting a colour wheel input inspired by this Hilaire Hiler design in Cooper Hewitt’s collection. (This wheel actually has 4 ‘psychological’ colour primaries and features 30 hues). The interface has 4 harmony options: monochromatic, complementary, analogous and spectrum (a rainbow colour option).

Color wheel picker, inspired by Hiler’s design, used in ‘Dive into Color’


‘Dive into Color’ installed at Cooper Hewitt. Photo credit: Caroline Koh Smith

‘Dive into Color’ installed at Cooper Hewitt. Photo credit: Caroline Koh Smith

What does the tool reveal?
Visualising the Cooper Hewitt data this way gives some sense of when colours appear in time. There are no results for purple pre-19th century. Perhaps because of the difficulty and expense of producing purple before synthetic dyes/pigments were developed in the 19th century?

Though, as often is the case interpreting collection visualisations, it is difficult to disentangle historical trends from the biases and character of what has been collected and how it has been catalogued. (And bear in mind I’m only visualising the 100 objects most saturated in colour for a search). For example, these green and purple Japanese prints of irises are clearly part of a set rather than indicating some colour trend around 1910. Using the images themselves as data points is helpful for diagnosing this.

The same purple-green visualisation demonstrates how the tool can connect artefacts across time, in this case with by similar colour scheme/design:

   
(Left) Frieze (USA), 1890–1910; Manufactured by Hobbs, Benton & Heath, (right) Sidewall, Anemone, 1960–66; Designed by Phoebe Hyde 

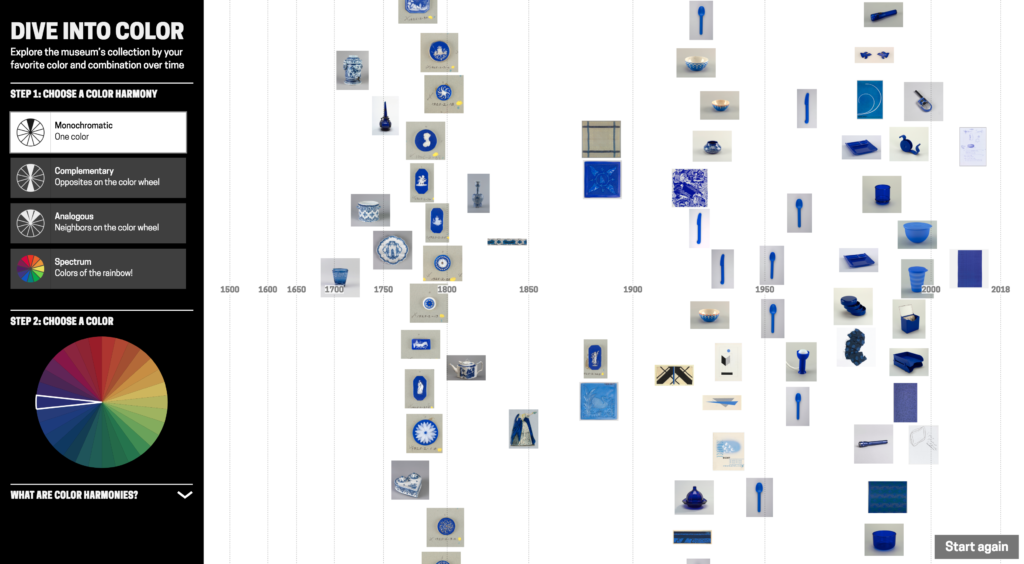
The tool surfaces colours, used in a particular material, that are strongly attached to design types. For example these English vivid blue and white late-18th century ceramic buttons/medallions:


(From left) Medallion (England), late 18th century, stoneware; Medallion (England), late 18th century, stoneware; Button (England), late 18th century; stoneware

Blue and white ceramics manufactured in the Netherlands in the late-17th century, early-18th century:

  
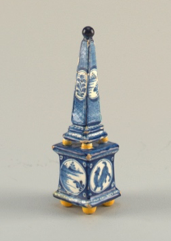
(From left) Plate (Netherlands), 1675–1725, tin-glazed earthenware; Plaque (Netherlands), 1675–1725, tin-glazed earthenware; Obelisk (Netherlands), ca. 1700–25, tin-glazed earthenware

And French red and white textiles in the late 18th/ early 19th century:


(From left) Textile (France), late 18th century, cotton; Textile (France), ca. 1850, cotton; Textile (France), 18th century, cotton

Visualising blue-yellow shows more saturated colour from mid-19th century onwards. Is this signalling changing fashion, or the availability of new synthetic dyes/pigments? Can we connect the more saturated harmony in designs from the mid-1800s with Chevreul’s influential text from the time ‘The Law of Simultaneous Colour Contrast’, describing how colour harmony can be used to create a more vibrant effect? Though a number of the earlier objects are textiles and the colours will have faded over time. Possibly a combination of these factors is at play here.

User evaluations
While I’ve discussed historical trends and the Cooper Hewitt collection, I’m also interested in how others might use a tool like this in their own projects, and with other collections. I conducted a number of interviews around this tool design with history of design students and colour history specialists, exploring their impressions of it and if/how they might use it in their own work. (I was also interested to talk with designers about using a tool like this for design inspiration, but struggled with recruiting!)

The history of design students (Masters students in History of Design from the Royal College of Art/Victoria & Albert Museum programme) discussed examples from their own work where such a tool could be useful. Example projects included: tracing the use of blue through time in anti-vaccination movement posters to convey trust; or pink clothing in the history of women’s protest movements. In both these examples a hue, rather than a more specific colour, was of interest. Out of these conversations, the most useful features to add would be a filter by object type, and to be able to narrow down a time period.

For the specialist colour audience, though, this tool design has some issues. Not least because I do not know how accurately the photos represent the true colours of the objects (what lighting conditions the photographs were taken in, if they have been retouched etc.). While the overall extracted colours seem generally good, they may not be precise enough for some. The control in searching by colour – only by hue – may also be too limited for some needs.

Seeing is believing?
Colour data is computationally extracted, in contrast with manually added metadata. Do these different cases require different considerations for designing visualisations?

In this post, I’ve used arguments like it ‘looked better’, or the results were ‘more satisfying’ to explain my design decision-making. Working with colour data I knew had errors, I was more comfortable adjusting parameters in my search queries and editing obviously wrong colour data to return what looked ‘better’ to me. For colour, you can immediately see when images appear in the visualisation don’t match. (Though, of course, looking at the visualised results will not tell you if there are absent items). In interviews, I asked whether this data massaging to produce more satisfying results bothered interviewees and was often told the person didn’t mind, but they’d worry if there were obvious errors appearing in the visualisation.

While prototyping the design in conversation with curators at Cooper Hewitt, we discussed the possibility of different versions of this tool: offering more control in search and not massaging parameters for in-depth researchers. But there is also value in visually satisfying results. As a curator expressed it: “We have a large number of professional designers and design students who come here … Just seeing beautiful examples of how people have used particular colour schemes is research. So the visually satisfying… seeing the most compelling works has a value as well. For the professional designers who, say ‘wow this is really incredible use of this colour scheme. I want to share this with my students.’

‘Dive into Color’ has since been exhibited in the London Design Festival 2018, and will hopefully go online at some point. Any feedback is very welcome: olivia.fletcher-vane@network.rca.ac.uk

Many thanks to Cooper Hewitt for their help with this project: especially Pamela Horn, Jennifer Cohlman Bracchi, Susan Brown and the technical team for getting ‘Dive into Color’ up and running in the galleries. Thanks to Neil Parkinson who showed me the Colour Reference Library at RCA, to Dr Alexandra Loske, Patrick Baty and RCA students for their thoughts, and to Jonny Jiang for help with the final UI design. And thanks to Stephen Boyd Davis for his continued help and support!

 

Parting gifts

Today is my last day at Cooper Hewitt, Smithsonian Design Museum. It’s been an incredible seven years. You can read all about my departure over on my personal blog if you are interested. I’ve got some exciting things on the horizon, so would love it if you’d follow me!

Parting gifts

Before I leave, I have been working on a couple last “parting gifts” which I’d like to talk a little about here. The first one is a new feature on our Collections website, which I’ve been working on in the margins with former Labs member, Aaron Straup Cope. He did most of the work, and has written extensively on the topic. I was mainly the facilitator in this story.

Zoomable Object Images

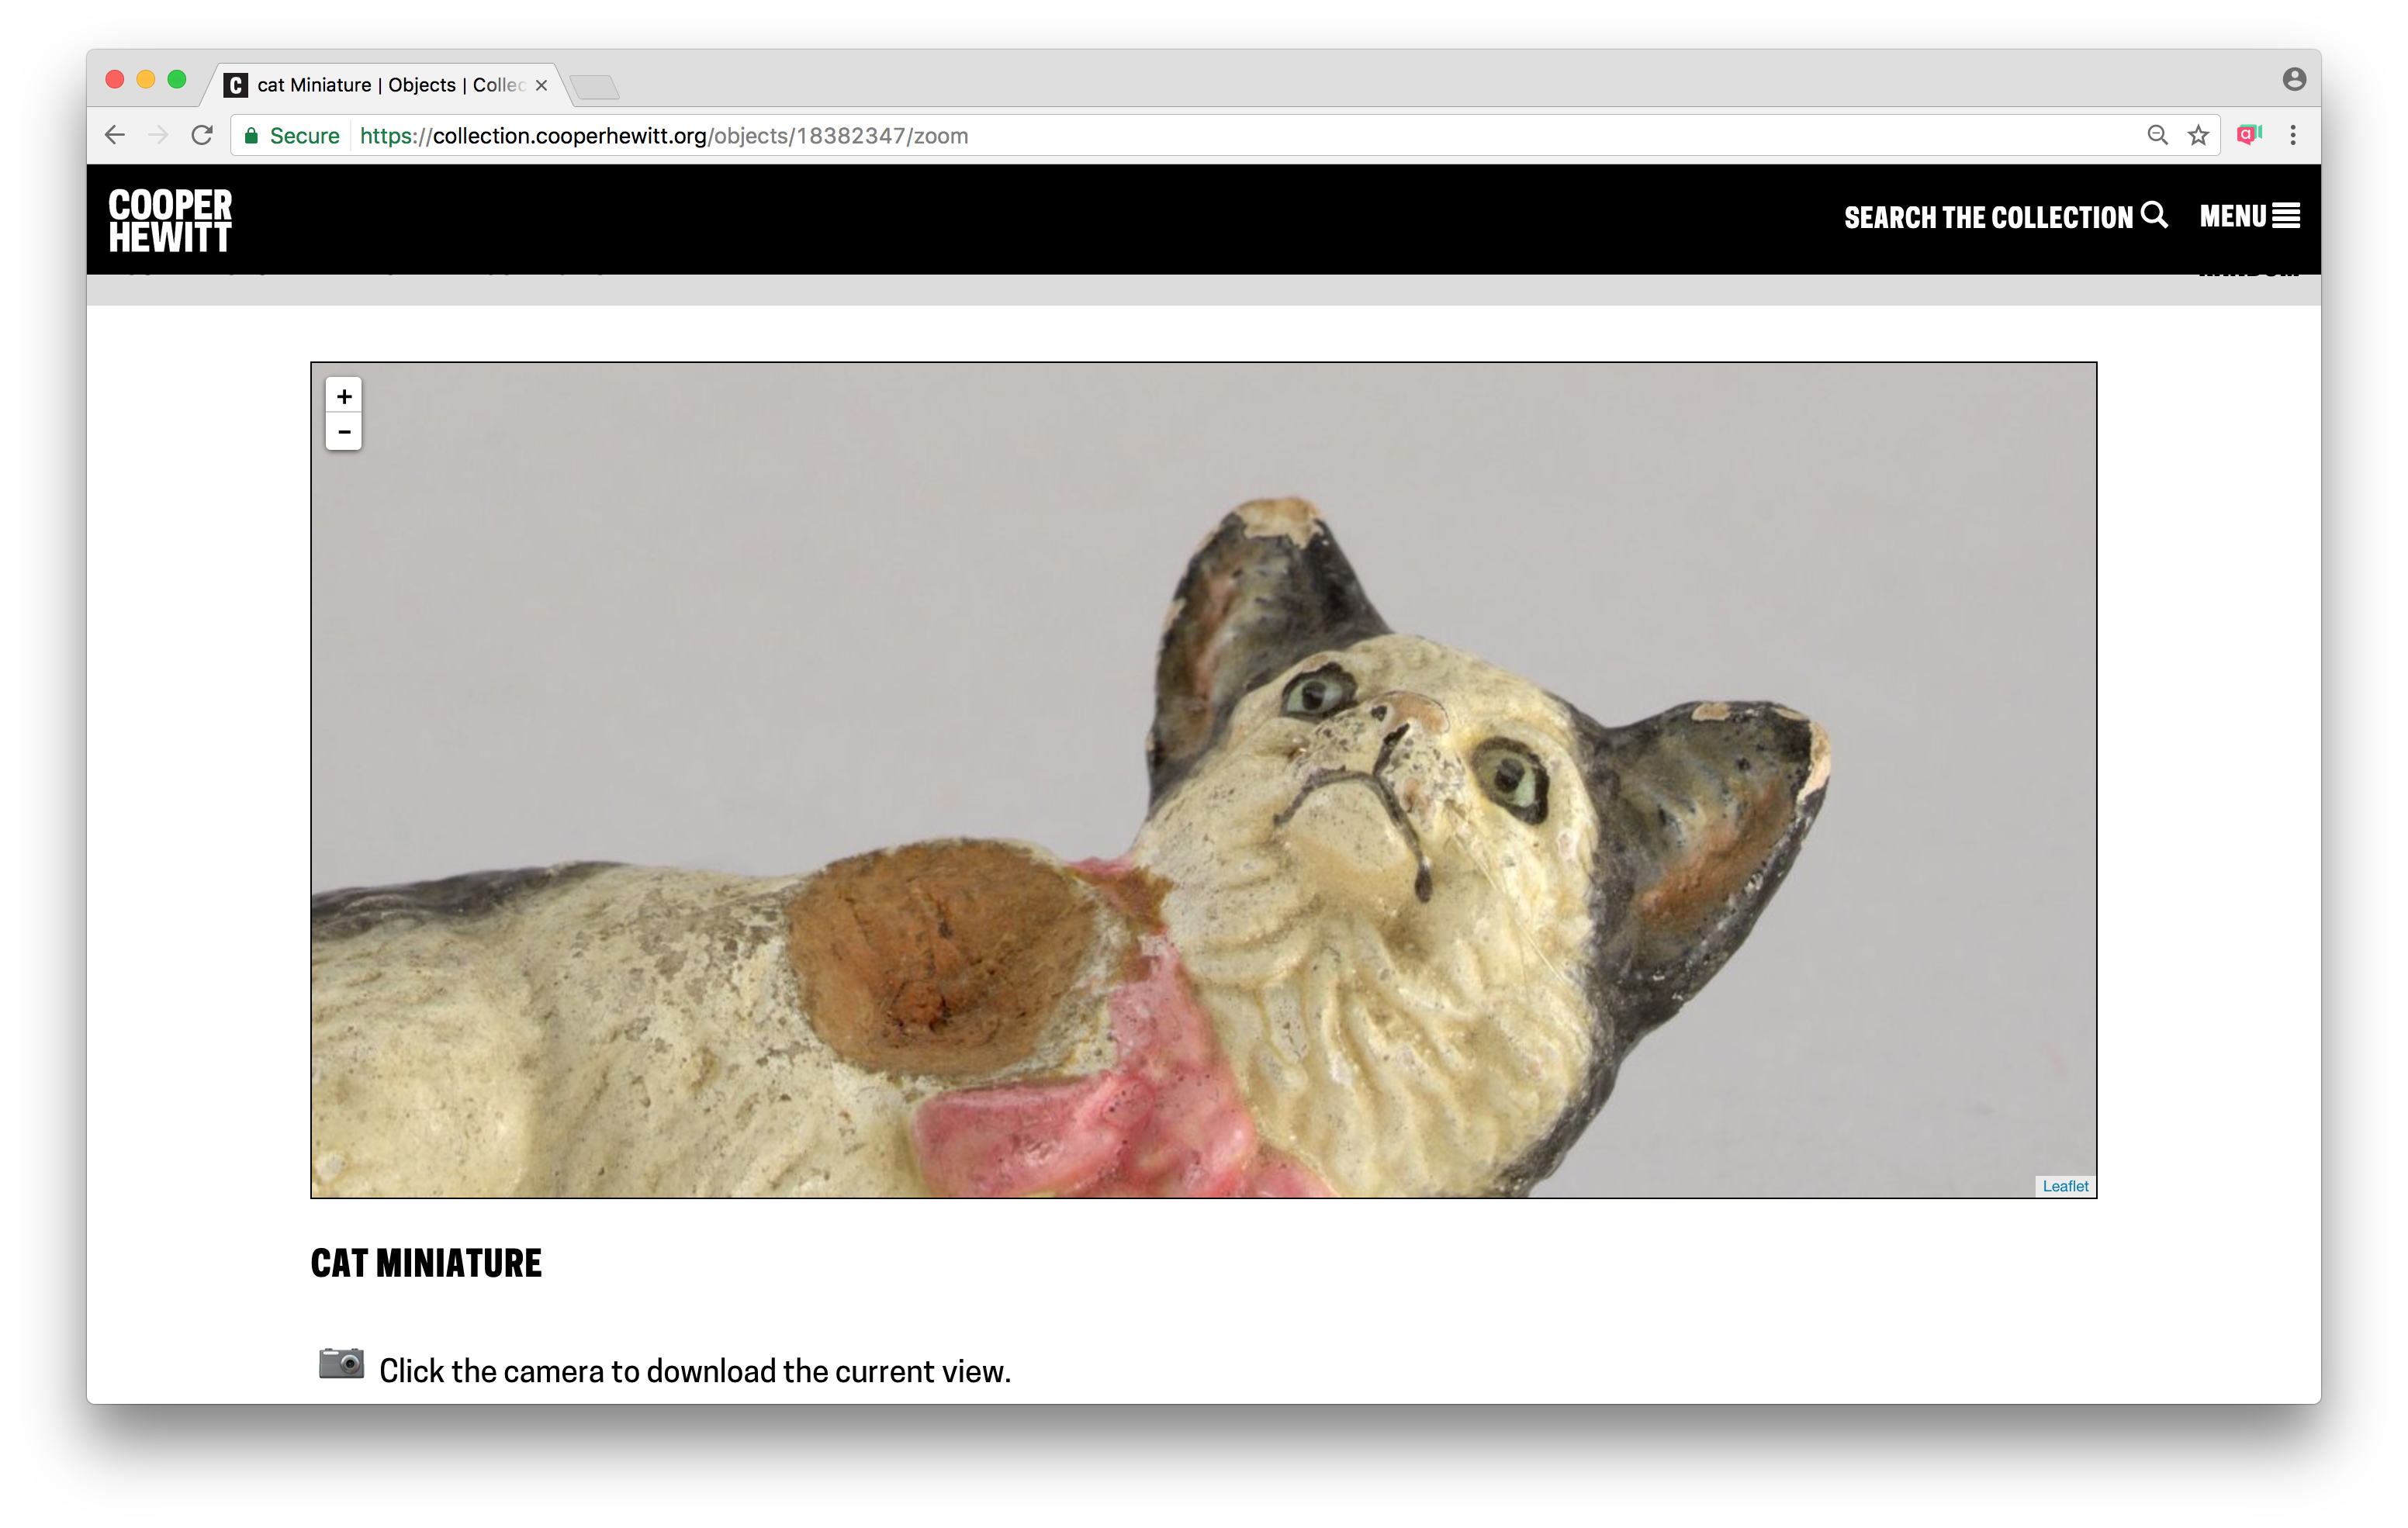
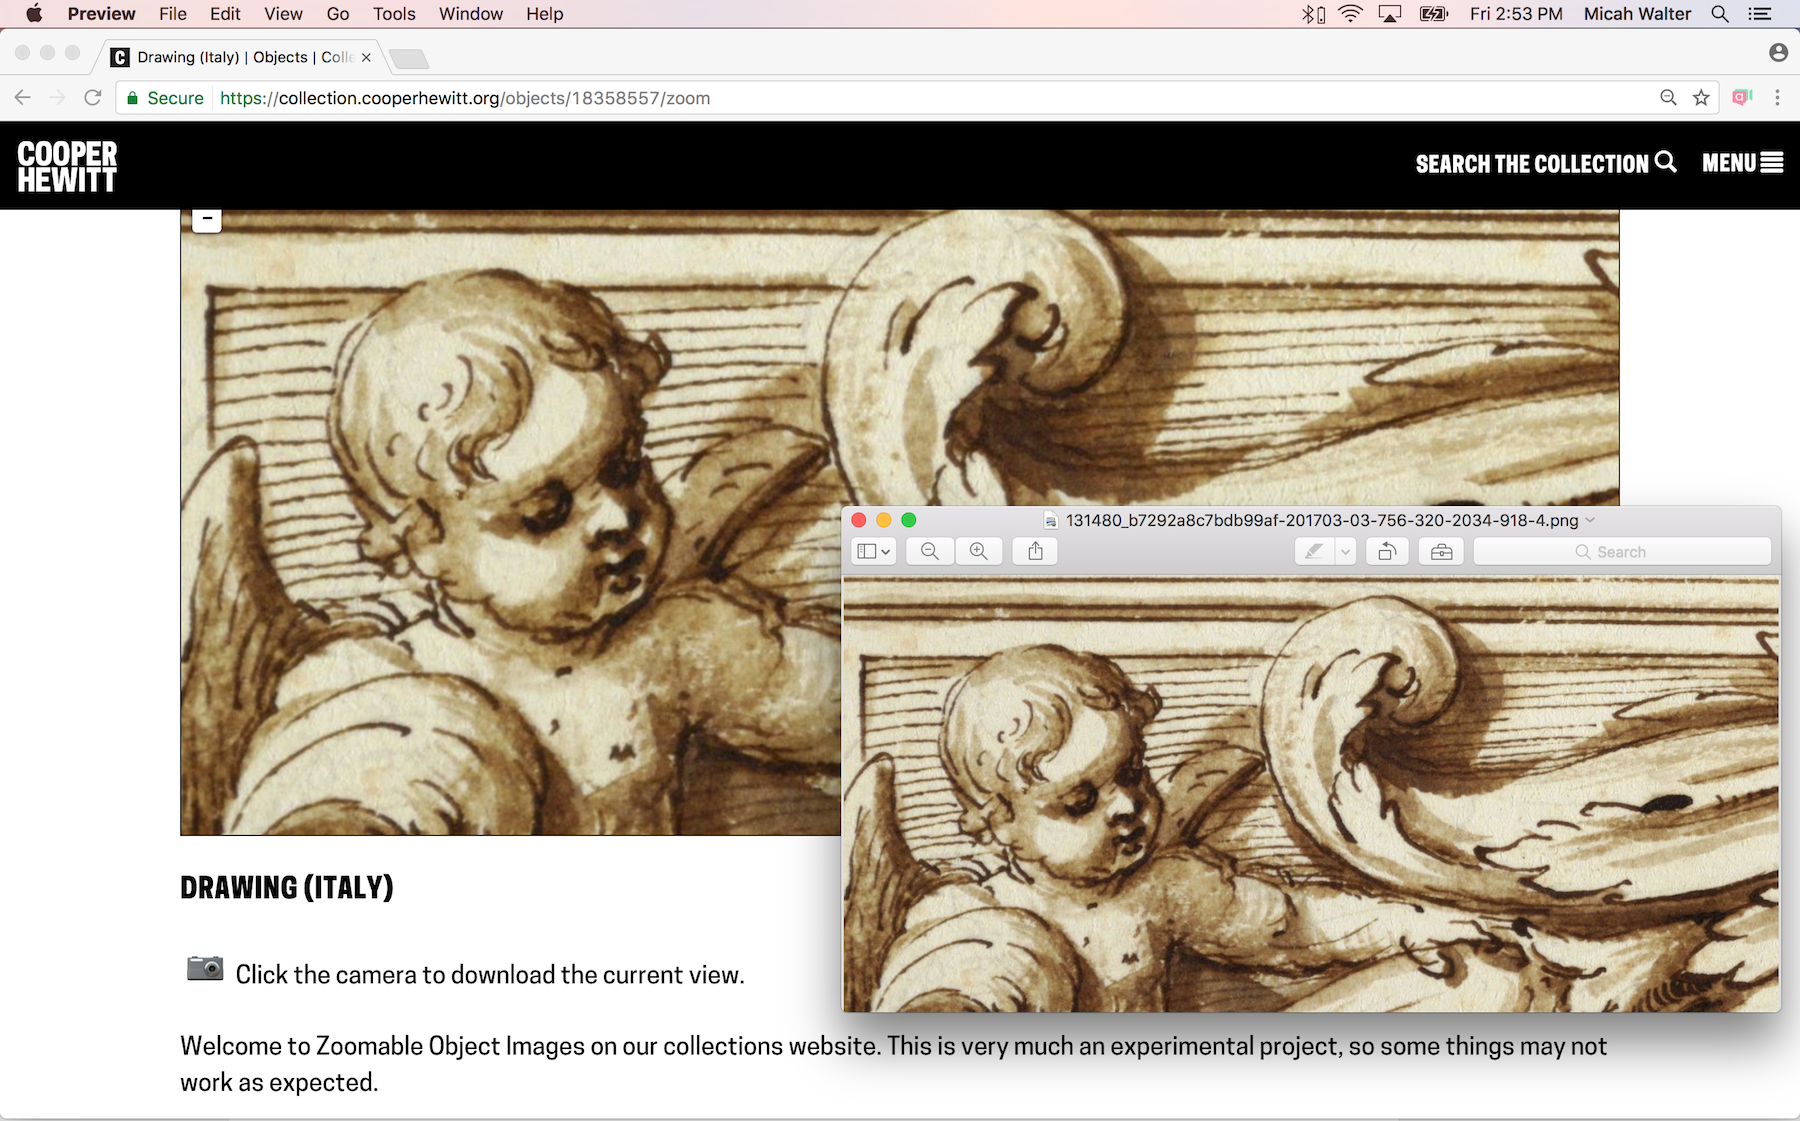
The feature, which I am calling “Zoomable Object Images” is live now and lets you zoom in on any object in our collection with a handy interface. Just go to any object page and add “/zoom” to the URL to try it out. It’s very much an experiment/prototype at this point, so things may not work as expected, and not ALL objects will work, but for the majority that do, I think it’s pretty darn cool!

Here’s an example, zoomed all the way in – https://collection.cooperhewitt.org/objects/18382347/zoom

Notice that there is also a handy camera button that lets you grab a snapshot of whatever you have currently showing in the window!

Click on the camera to download a snapshot of the view!

This project started out as a fork of some code developed around the relatively new IIIF standard that seems to be making some waves within the cultural sector. So, it’s not perfectly compliant with the standard at the moment ( Aaron says “there are capabilities in the info.json files that don’t actually exist, because static files”), but we think it’s close enough.

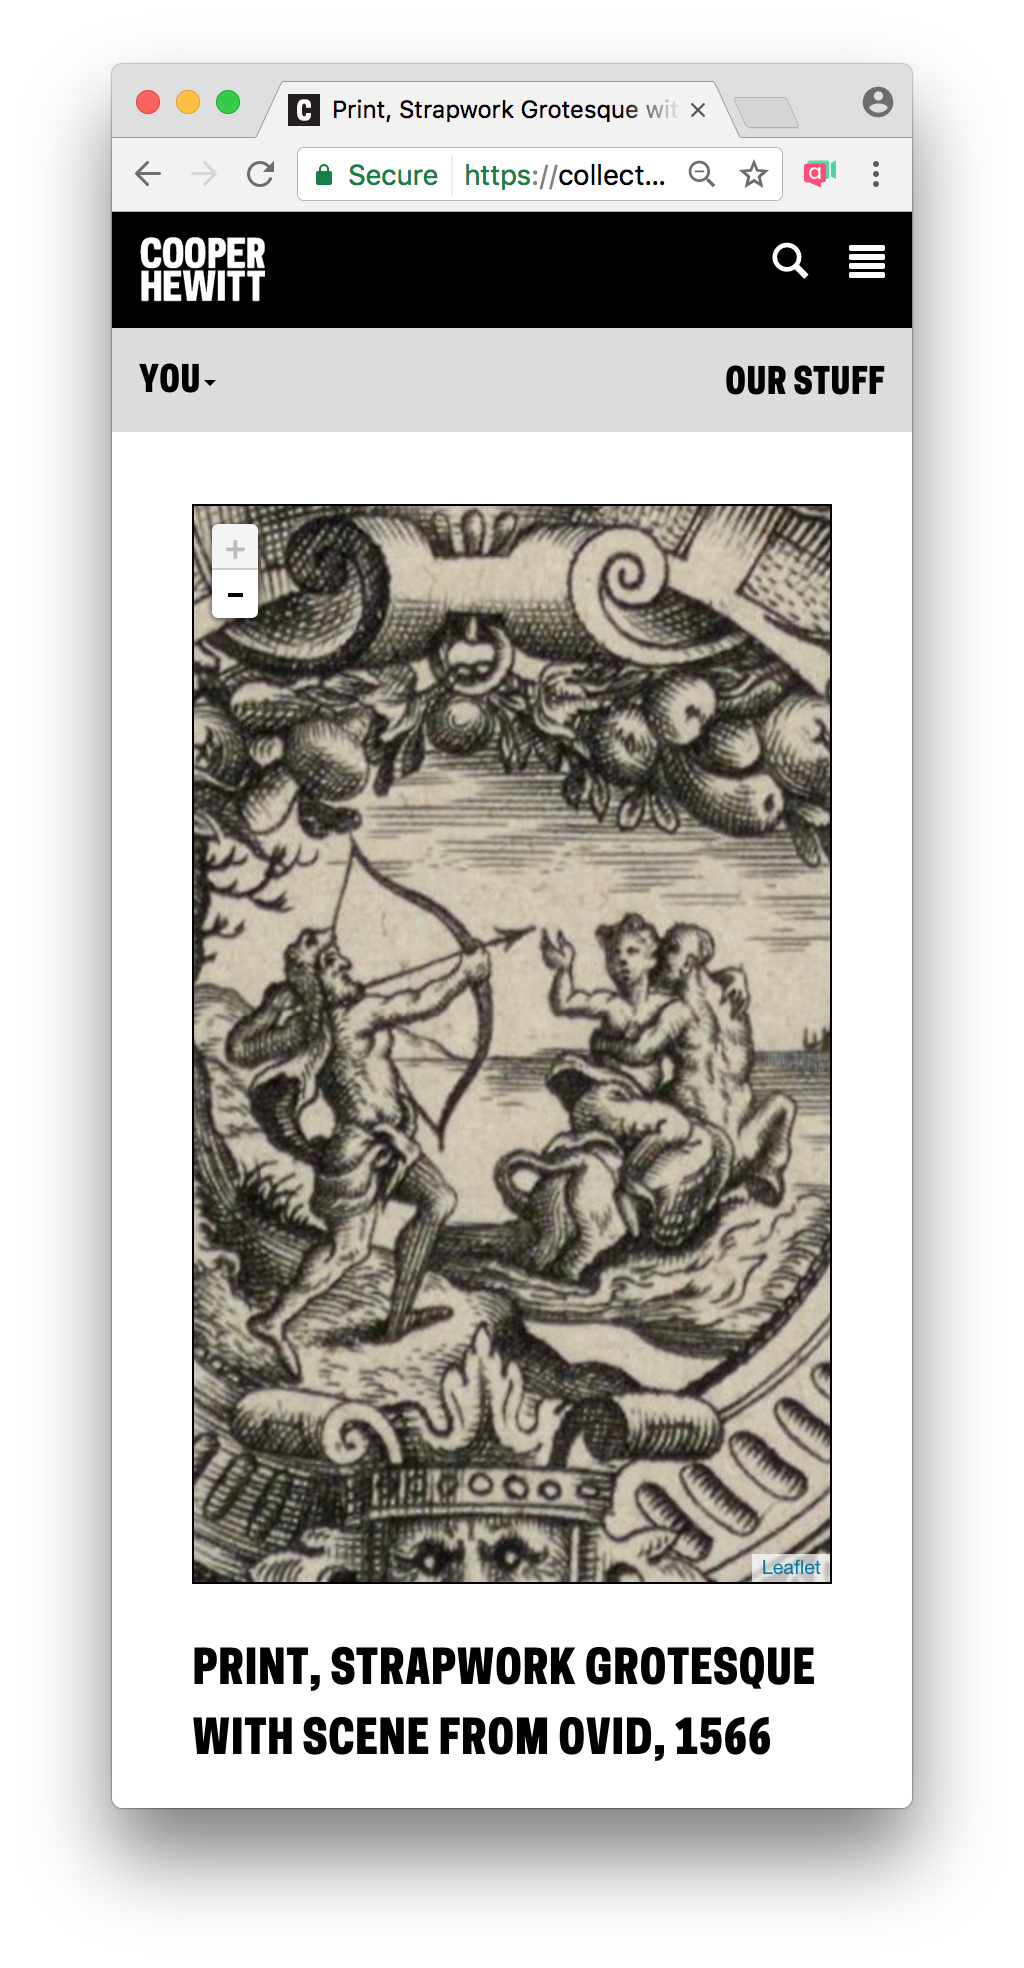
You can’t tell form this image, but you can pinch and zoom this on your mobile device.

To do the job of creating zoomable image tiles for over 200,000 object we needed a few things. First, we built a very large EC2 server. We tried a few instance sizes and eventually landed on an m4.2xlarge which seemed to have enough CPU and RAM to get the job done. I also added a terabyte of storage to the instance so we’d have enough room to store all the images as we processed them.

Aaron wrote the code to download all of our high res image files and process them into tiles. The code is designed to run with multiple threads so we can get the most efficiency out of our big-giant-ec2 server as possible (otherwise we’d be waiting all year for the results). We found out after a few attempts that there was one major flaw in the whole operation. As we started to generate thousands and thousands of small files, we also started to run up to the limit of inodes available to us on our boot drive. I don’t know if we ever really figure this out, but it seemed to be that the OS was trying to index all those tiny files in some way that was causing the extra overhead. There is likely a very simple way to turn that off, but in the interest of getting the job done we decided to take an alternative route.

Instead of processing and saving the images locally and then transferring them all to our S3 storage bucket, Aaron rewrote the code so that it would upload the files as they were processed. S3 would be their final resting place in any case, so they needed to get there one way or another and this meant that we wouldn’t need so much storage during processing. We let the script run and after a few weeks or so, we had all our tiles, neatly organized and ready to go on S3.

Last but not least, Aaron wrote some code that allowed me to plug it into our collections website, resulting in the /zoom pages that are now available. Woosh!

Check out the code here https://github.com/thisisaaronland/go-iiif – and dive into the tl;dr discussion over here if you’re into this kinda thing.

Cooper Hewitt in a box

The second little gift is around some work I’ve been doing to try and make developing and maintaining code at Cooper Hewitt a tiny bit better.

Since we started all this work we’ve been utilizing a server that sits on the third-floor (right next to Josue) called, affectionately, “Bill.” Bill (pictured above) has been our development machine for many years, and has also served as the server in charge of extracting all of our collection data and images from TMS and getting them published to the web. Bill is a pretty important piece of equipment.

The pros to doing things this way are pretty clear. We always have, at the ready, a clone of our entire technology stack available to use for development. All a developer needs to do is log in to Bill and get coding. Being within the Smithsonian network also means we get built in security, so we don’t need to think about putting passwords in place or trying to hide in plain site.

The cons are many.

For one, you need to be aware of each other. If more than one developer is working on the same file at the same time, bad things can happen. Sam sort of fixed this by creating individual user instances of the major web applications, but that requires a good bit of work each time you set up a new developer. Also, you are pretty much forced to use either Emacs or Vi. We’ve all grown to love Emacs over time, but it’s a pain if you’ve never used it before as it requires a good deal of muscle memory. Finally, you have to be sitting pretty close to Bill. You at least need to be on the internal network to access it easily, so remote work is not really possible.

To deal with all of this and make our development environment a little more developer friendly, I spent some time building a Vagrant machine to essentially clone Bill and make it portable.

Vagrant is a popular system amongst developers since it can easily replicate just about any production environment, and allows you to work locally on your MacBook from your favorite coffee shop. Usually, Vagrant is setup on a project by project basis, but since our tech stack has grown in complexity beyond a single project ( I’ve had to chew on lots of server diagrams over the years ), I chose to build more of a “workspace.”

I got the idea from Dan Phiffer at Mapzen who did the same for their Who’s on First project.

Essentially, there is a simple Vagrantfile that builds the machine to match our production server type, and then there is a setup.sh script that does the work of installing everything. Within each project repository there is also a /vagrant/setup.sh script that installs the correct components, customized a little for ease of use within a Vagrant instance. There is also a folder in each repo called /data with tools that are designed to fetch the most recent data-snapshots from each application so you can have a very recent clone of what’s in production. To make this as seamless as possible, I’ve also added nightly scripts to create “latest” snapshots of each database in a place where they Vagrant tools can easily download them.

This is all starting to sound very nerdy, so I’ll just sum it up by saying that now anyone who winds up working on Cooper Hewitt’s tech stack will have a pretty simple way to get started quickly, will be able to use their favorite code editor, and will be able to do so from just about anywhere. Woosh!

Lastly

Lastly, it’s been an incredible journey working here at Cooper Hewitt and being part of the “Labs.” We’ve done some amazing work and have tried to talk about it here as openly as possible–I hope that continues after I’m gone. Everyone who has been a part of the Labs in one way or another has meant a great deal to me. It’s a really exciting place to be.

There is a ton more work to do here at Cooper Hewitt Labs, and I am really excited to continue to watch this space and see what unfolds. You should too!

Thanks for everything.

-micah

Mass Digitization: Digital Asset Management

This part two in a series on digitization. My name is Allison Hale, Digital Imaging Specialist at Cooper Hewitt. I started working at the museum in 2014 during the preparations for a mass digitization project. Before the start of digitization, there were 3,690 collection objects that had high resolution, publication quality photography. The museum has completed phase two of the project and has completed photography of more than 200,000 collection objects.


Prior to DAMS (Digital Asset Management System), image files were stored on optical discs and RAID storage arrays. This was not an ideal situation for our legacy files or for a mass digitization workflow. There was a need to connect image assets to the collections database, The Museum System, and to deliver files to our public-facing technologies.

Vendor Server to DAMS Workflow

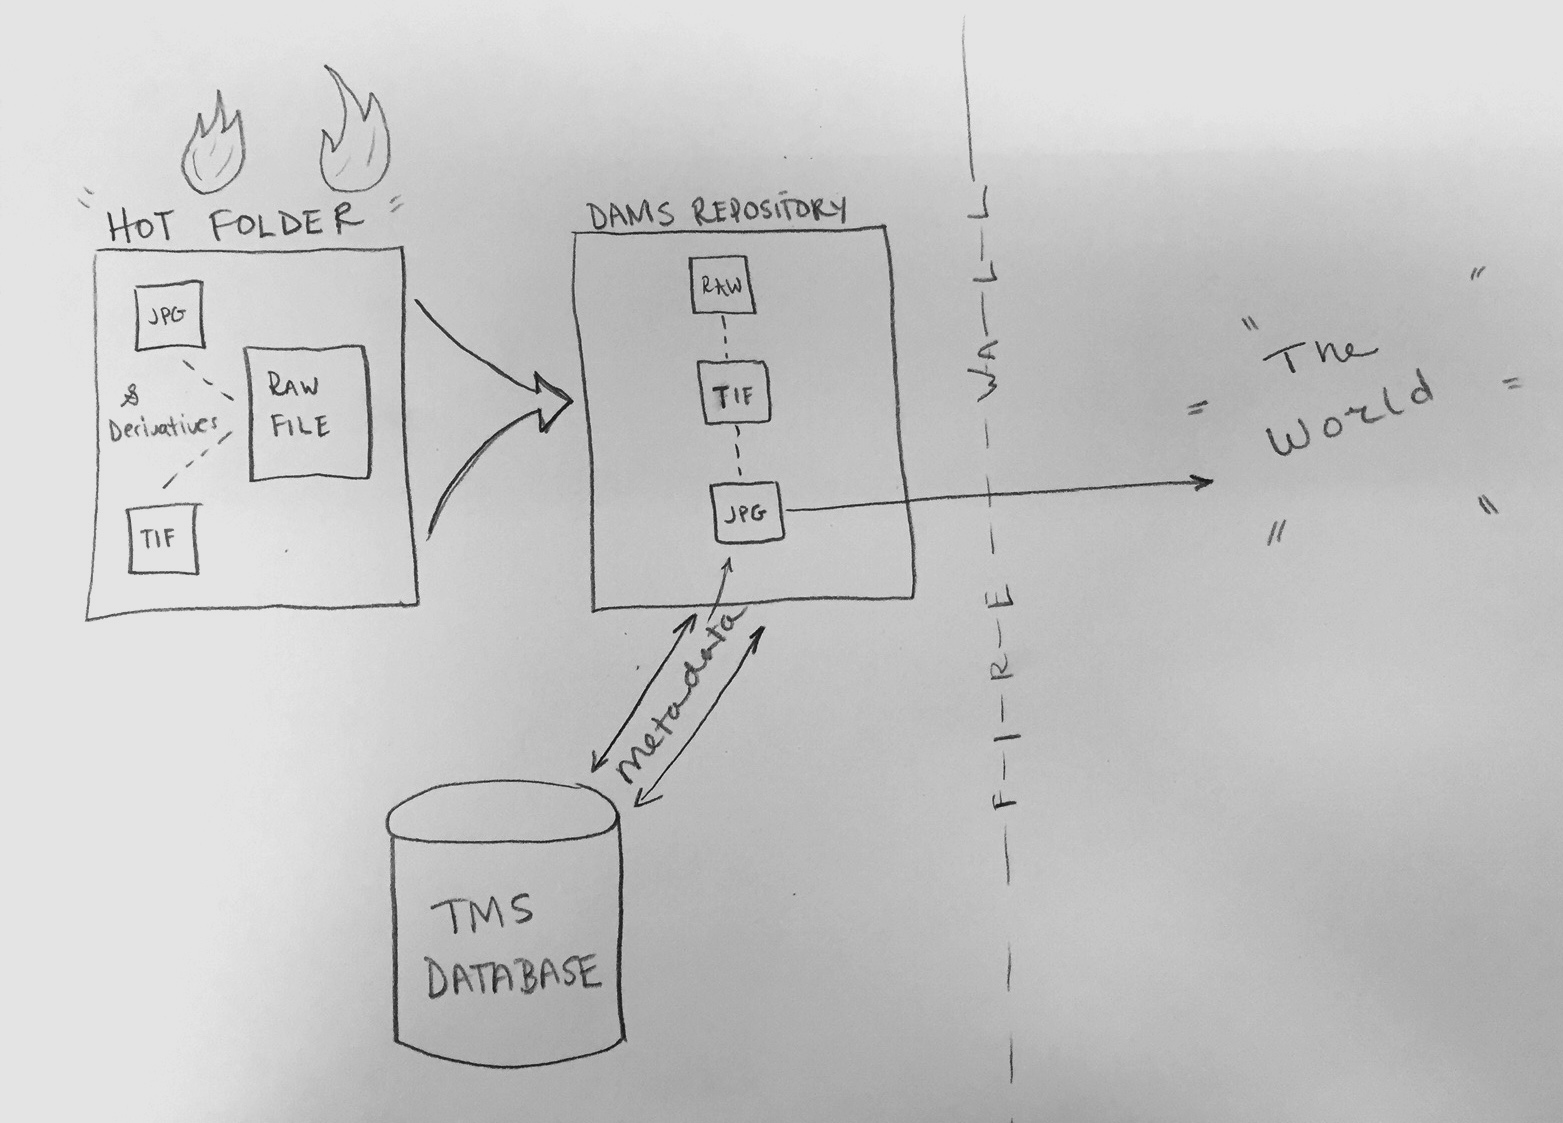
The Smithsonian’s DAMS Team and Cooper Hewitt staff worked together to build workflow that could be used daily to ingest hundreds of images. The images moved from a vendor server to Smithsonian’s digital repository. The preparation for the project began with 5 months of planning, testing, and upgrades to network infrastructure to increase efficiency. During mass digitization, 4 Cooper Hewitt staff members shared the responsibility for daily “ingests” or uploads of assets to DAMS. Here is the general workflow:

Cooper Hewitt to DAMS workflow.

Cooper Hewitt to DAMS workflow.

  • Images are stored by vendor in a staging server, bucketed by a folder titled with shoot date and photography station. The vendor delivers 3 versions of each object image in separate folders: RAW (proprietary camera format or DNG file), TIF (full frame/with image quality target), JPG (full-scale, cropped and ready for public audience)
  • Images are copied from the server into a “hot folder”–a folder that is networked to DAMS. The folder contains two areas, a temporary area and then separate active folders called MASTER, SUBFILE, SUB_SUBFILE
  • Once the files have moved to the transfer area, the RAW files move to the MASTER folder, the TIF to the SUBFILE folder, and the JPG files to the SUB_SUBFILE folder. The purpose of the MASTER/SUB/SUB_SUB structure is to keep the images parent-child linked once they enter DAMS. The parent-child relationship keeps files “related” and indexable
  • An empty text file called “ready.txt” is put into the MASTER folder. Every 15 minutes a script runs to search for the ready.txt command
  • Images are ingested from the hot folder into the DAMS storage repository
  • During the initial setup, the DAMS user created a “template” for the hot folder. The template automatically applies bulk administrative information to the image’s DAMS record, as well as categories and security policies
  • Once the images are in DAMS, security policies and categories can be changed to allow the images to be pushed to TMS (The Museum System) via CDIS (Collection Dams Integration System) and IDS (Image Delivery Service)

DAMS to TMS and Beyond: Q&A with Robert Feldman

DAMS is repository storage and is designed to interface with databases. A considerable amount of planning and testing went into connecting mass digitization images to Cooper Hewitt’s TMS database. This is where I introduce Robert Feldman, who works with Smithsonian’s Digital Asset Management Team to manage all aspects of CDIS—Collection Dams Integration System. Robert has expertise in software development and systems analysis. A background in the telecommunications industry and experience with government agencies allows him to work in a matrixed environment while supporting many projects.

AH: Can you describe your role at Smithsonian’s DAMS?

RF: As a member of the DAMS team, I develop and support CDIS (Collection-DAMS Integration System). My role has recently expanded to creating and supporting new systems that assist the Smithsonian OCIO’s goal of integrating the Smithsonian’s IT systems beyond the scope of CDIS. One of these additional tools is VFCU (Volume File Copy Utility). VFCU validates and ingests large batches of media files into DAMS. CDIS and VFCU are coded in Java, and makes use of Oracle and SQL-Server databases.

AH: We understand that CDIS was written to connect images in DAMS to the museum database. Can you tell us more us more about the purpose of the code?

RF: The primary idea behind CDIS is to identify and store the connection between the image in DAMS and the rendition in TMS. Once these connections are stored in the CDIS database, CDIS can use these connections to move data from the DAMS system to TMS, and from TMS to DAMS.

AH: Why is this important?

RF: CDIS provides the automation of many steps that would otherwise be performed manually. CDIS interconnects ‘all the pieces together’. The CDIS application enables Cooper Hewitt to manage its large collection in the Smithsonian IT systems in a streamlined, traceable and repeatable manner, reduces the ‘human error’ element, and more.

AH: How is this done?

RF: For Starters, CDIS creates media rendition records in TMS based on the image in DAMS. This enables Cooper Hewitt to manage these renditions in TMS hours after they are uploaded into DAMS and assigned the appropriate DAMS category.

CDIS creates the media record in TMS by inserting new rows directly into 6 different tables in the TMS database. These tables hold information pertaining to the Media and Rendition records and the linkages to the object record. The Thumbnail image in TMS is generated by saving a copy the reduced resolution image from DAMS into the database field in TMS that holds the thumbnail, and a reference to the full-resolution image is saved in the TMS MediaFiles table.

This reference to the full-resolution image consists of the DAMS UAN (the Unique Asset Name – a unique reference to the particular image in DAMS) appended to the IDS base pathname. By stringing together the IDS base pathname with the UAN, we will have a complete url – pointing to the IDS derivative that is viewable in any browser.

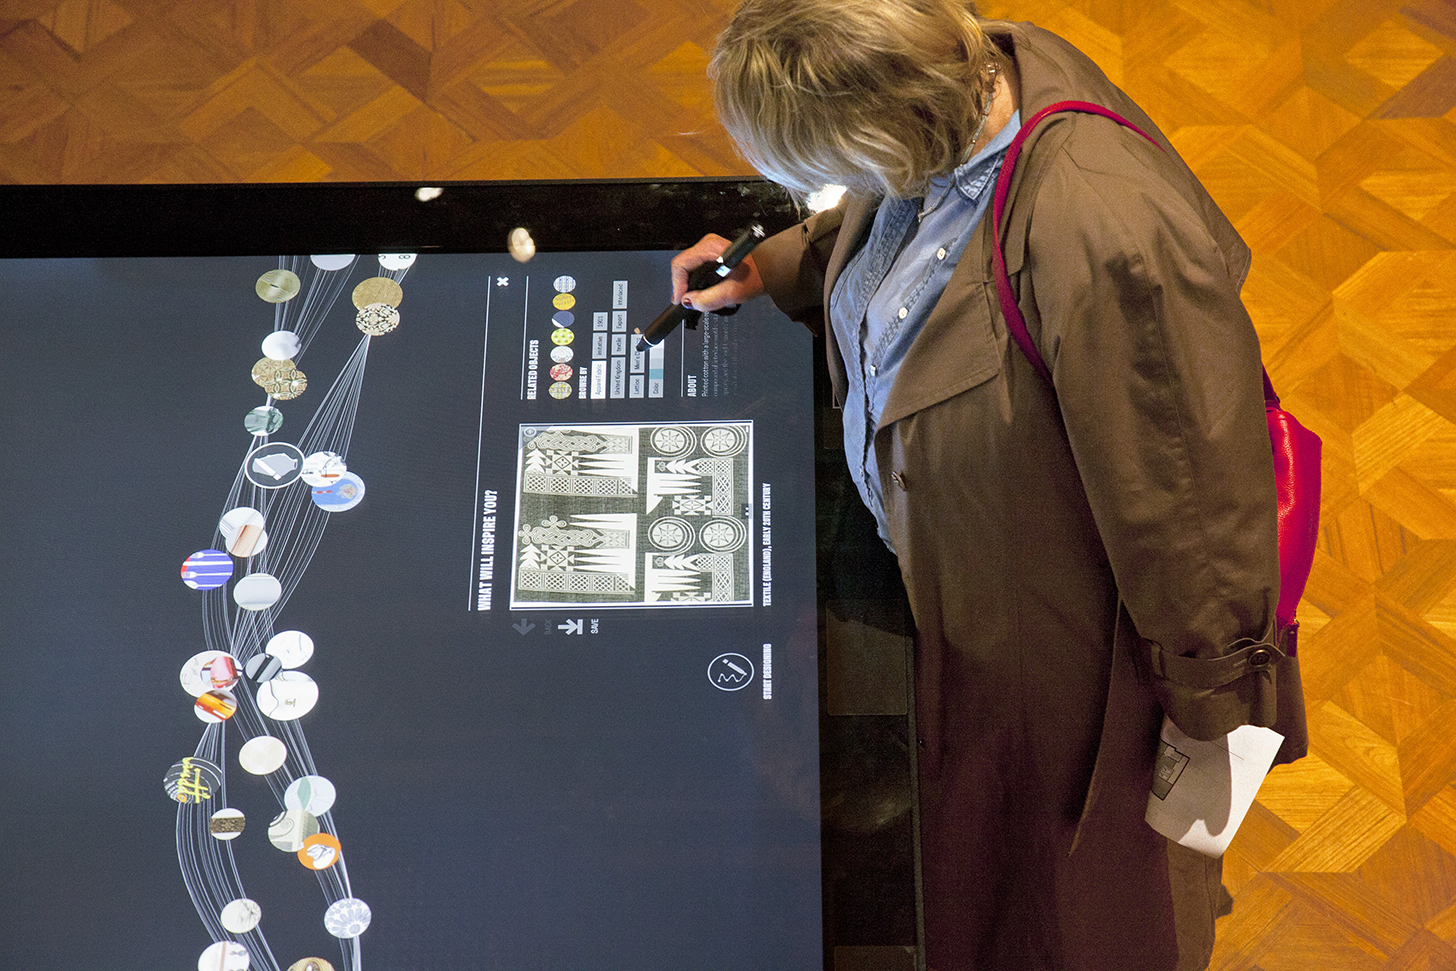
The full references to this DAMS UAN and IDS pathname, along with the object number and other descriptive information populates a feed from TMS. The ‘Collections’ area of the Cooper Hewitt website uses this feed to display the images in its collection. The feed is also used for the digital tables and interactive displays within the museum and more!

A museum visitor looking at an image on the Digital Table. Photo by Matt Flynn.

A museum visitor looking at an image on the Digital Table. Photo by Matt Flynn.

Another advantage of the integration with CDIS is Cooper Hewitt no longer has to store a physical copy of the image on the TMS media drive. The digital media image is stored securely in DAMS, where it can be accessed and downloaded at any time, and a derivative of the DAMS image can be easily viewed by using the IDS url. This flow reduces duplication of effort, and removes the need for Cooper Hewitt to support the infrastructure to store their images on optical discs and massive storage arrays.

When CDIS creates the media record in TMS, CDIS saves the connection to this newly created rendition. This connection allows CDIS to bring object and image descriptive data from TMS into DAMS metadata fields. If the descriptive information in TMS is altered at any point, these changes are automatically carried to DAMS via a nightly CDIS process. The transfer of metadata from TMS to DAMS is known as the CDIS ‘metadata sync’ process.

On the left, image of object record in The Museum System database. On right, object in the DAMS interface with mapped metadata from the TMS record.

On the left, image of object record in The Museum System database. On right, object in the DAMS interface with mapped metadata from the TMS record. Click photo to enlarge.

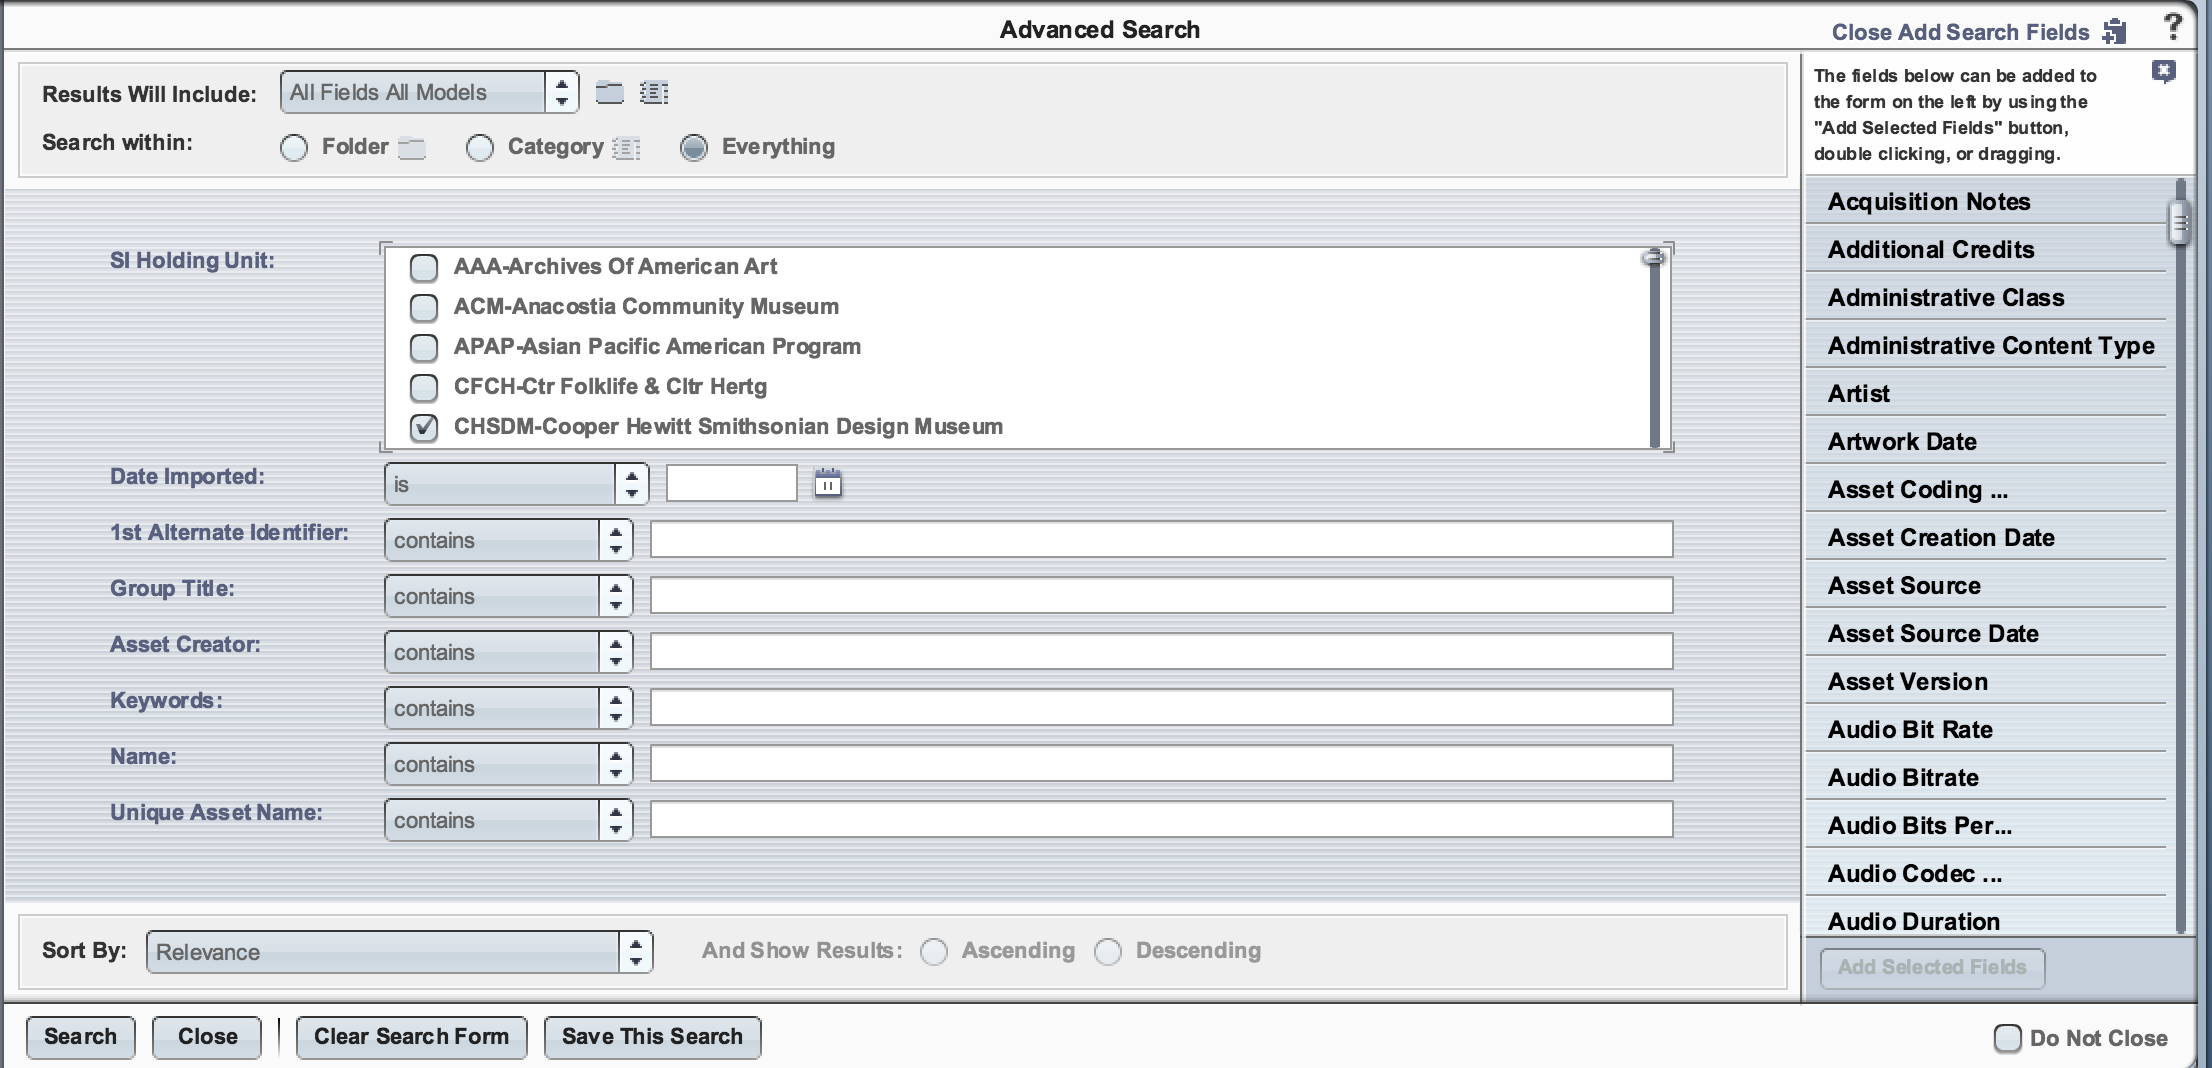
Because CDIS carries the object descriptive data into searchable metadata fields in the DAMS, the metadata sync process makes it possible to locate images in the DAMS. When a DAMS user performs a simple search of any of the words that describe the object or image in TMS, all the applicable images will be returned, provided of course that the DAMS user has permissions to see those particular images!

Image of search functionality in DAMS. Click to enlarge image.

Image of search functionality in DAMS. Click to enlarge image.

The metadata sync is a powerful tool that not only provides the ability to locate Cooper Hewitt owned objects in the DAMS system, but also provides Cooper Hewitt control of how the Smithsonian IDS (Image Delivery Service) displays the image. Cooper Hewitt specifies in TMS a flag to indicate whether to make the image available to the general public or not, and the maximum resolution of the image to display on public facing sites on an image by image basis. With each metadata update, CDIS transfers these settings from TMS to DAMS along with descriptive metadata. DAMS in turn sends this information to IDS. CDIS thus is a key piece that bridges TMS to DAMS to IDS.

AH: Can you show us an example of the code? How was it written?

RF: What was once a small utility, CDIS has since expanded to what may be considered a ‘suite’ of several tools. Each CDIS tool or ‘CDIS operation type’ serves a unique purpose.

For Cooper Hewitt, three operation types are used. The ‘Create Media Record’ tool creates the TMS media, then the ‘Metadata Sync’ tool brings over metadata to DAMS, and finally the ‘Timeframe Report’ is executed. The Timeframe Report emails details of the activity that has been performed (successes and failures) in the past day. Other CDIS operations are used to support the needs of other Smithsonian units.

The following is a screenshot of the listing of the CDIS code, developed in the NetBeans IDE with Java. The classes that drives each ‘operation type’ are the highlighted classes in the top left.

A screenshot of the listing of the CDIS code, developed in the NetBeans IDE with Java.

A screenshot of the listing of the CDIS code, developed in the NetBeans IDE with Java.

It may be noted that more than half of the classes reside in folders that end in ‘Database’. These classes map directly to database tables of the corresponding name, and contain functions that act on those individual database tables. Thus MediaFiles.java in edu.si.CDIS.CIS.TMS.Database performs operations on the TMS table ‘MediaFiles’

Something I find a little more interesting than the java code is the configuration files. Each instance of CDIS requires two configuration files that enable OCIO to tailor the behavior of CDIS to each Smithsonian unit’s specific needs. We can examine one of these configuration files- the .xml formatted cdisSql.xml file.

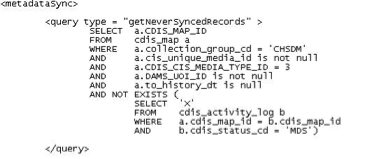
The use of this file is two-fold. First, it contains the criteria CDIS uses to identify which records are to be selected each time a CDIS process is run. The criteria is specified by the actual SQL statement that CDIS will use to find the applicable records. To illustrate the first use, here is an example from the cdisSql.xml file:

The cdisSql.xml file.

The cdisSql.xml file.

This query is part of the metadataSync operation type as the xml tag indicates. This query obtains a list of records that have been connected in CDIS, are owned by Cooper Hewitt (CHSDM), and have never been metadata synced before (there is no metadata sync record in the cdis_activity_log table).

A second use for the cdisSql.xml file is it contains the mappings used in the metadata sync. Each Smithsonian unit has different fields in TMS that are important to them. Because Cooper Hewitt has its own xml file, CDIS provides specialized metadata mapping for Cooper Hewitt.

Code for the metadata sync mapping.

A selection of code for the metadata sync mapping.

If we look at the first query, the creditLine in TMS database table ‘object’ is mapped to the field ‘credit’ in DAMS. Likewise, the data in the TMS object table, column description is carried over to the description field in DAMS, etc. In the second query, there are three different fields in TMS appended to each other (with spaces between them) to make up the ‘other_constraints’ field in DAMS. In the third query (which is indicated to be a ‘cursor append’ query with a delimiter ‘,’ a list of values may be returned from TMS. Each member of the list is concatenated into to a single field in DAMS (the DAMS ‘caption’ field) with a comma (the specified delimiter) separating each value returned in the list from TMS. The metadata sync process combines the results of all three of these queries AND MORE to generate the update for metadata sync in DAMS.

The advantage of locating these queries in the configuration file is it allows for flexibility for each Smithsonian unit to be configured with different criteria for the metadata sync. This design also permits CDIS to perform a metadata sync on other CIS systems (besides TMS) that may use any variety of RDBMS systems. As long as the source data in can be selected with SQL query, it can be brought over to the DAMS.

AH: To date, how many Cooper Hewitt images have been successfully synced with the CDIS code?

RF: For Cooper Hewitt, CDIS currently maintains the TMS to DAMS connections of nearly 213,000 images. This represents more than 172,000 objects.

AH: From my perspective, many of our team projects have involved mapping metadata. Are there any other parts of the code that you find challenging, rewarding?

RF: As for challenges – I deal with many different Smithsonian Units. They each have their own set of media records in various IT systems and they all need to be integrated. There is a certain balancing act that must take place nearly every day. That is provide for the unique needs for each Smithsonian Unit, while also identifying the commonalities among the units. Because CDIS is so flexible, without proper planning and examining the whole picture with the DAMS team, CDIS would be in danger of becoming too unwieldy to support.

As far as rewards- I have always valued projects that allow me to be creative. Investigating the most elegant ways of doing things allows me to keep learning and be creative at the same time. The design of new processes, such as the newly redesigned CDIS and VFCU fulfill that need. But the most rewarding experience is discovering how my efforts are used by researchers, and educate the public in the form of public facing websites and interactive displays. Knowing that I am a part of the historical digitization effort the Smithsonian is undertaking is very rewarding in itself.

AH: Has the CDIS code changed over the years? What types of upgrades have you recently worked on?

RF: CDIS has changed much since we have integrated the first images for Cooper Hewitt. The sheer volume of the data flowing through CDIS has increased exponentially. CDIS now connects well over half a million images owned by nearly a dozen different Smithsonian Units, and that number is growing daily.

CDIS has undergone many changes to support such an increase in scale. In CDIS version 2, CDIS was intrinsically hinged to TMS and relied on database tables in each unit’s own TMS system. For CDIS version 3, we have taken issues such as this into account, and have migrated the backend database for CDIS to a dedicated schema within DAMS database. Cooper Hewitt’s instance of CDIS was updated to version 3 less than two months ago.

Now that the CDIS database is no longer hinged to TMS, CDIS version 3 has opened the doors to mapping DAMS records to a larger variety of CIS systems. We no longer depend the TMS database structure, or even that the CIS system uses the SQL-Server RDBMS. This has enabled the Smithsonian OCIO the ability to expand CDIS’s role beyond TMS and allow integration with other CIS systems such as the National Museum of Natural History’s EMuseum, the Archives of American Art’s proprietary system as well as the Smithsonian Gardens IRIS-BG. All three are currently using the new CDIS today, and there are more coming on board to integrate with CDIS in the near future!


Conclusion

One challenge has been correcting mass digitization images that end up in the wrong object record. If an object was incorrectly barcoded, the image in barcode’s corresponding collections record is also incorrect. Once the object record’s image is known to be incorrect, the asset must be exported, deleted, and purged from DAMS. The image must also be deleted from the media rendition in TMS. When the correct record is located, the file’s barcode or filename can be changed and re-ingested into DAMS. The process can take several days.

The adoption of Smithsonian’s DAMS system has greatly improved redundancy and our workflow with digitization and professional photography. The flexibility of the CDIS coding has allowed me to work with photography assets of our collection’s objects, or “collection surrogates” and images from other departments, such as the Library. Overall, the change has been extremely user-friendly.

Thank you Smithsonian’s DAMS Team!


Mass Digitization: Workflows and Barcodes

This is my first post in a four-part series about digitization. My name is Allison Hale, Digital Imaging Specialist at Cooper Hewitt. I started working at the museum in 2014 during the preparations for a mass digitization project. Before the start of digitization, there were 3,690 collection objects that had high resolution, publication quality photography. The museum is currently in phase two of the project and has completed photography of more than 180,000 collection objects.


Workflows

Cooper Hewitt was the first Smithsonian unit to take on digitization of an entire collection. Smithsonian’s Digitization Project Office directed the project and an onsite vendor completed the imaging. Museum staff played an intensive role, allocating up to fifty percent of a workweek on digitization administration. Additional hires in the Registration and Conservation departments eased the daily organization and handling of the objects.

The goal was to take a physical object from storage shelf to public-facing digital image within 24-48 hours.

The goal was to take a physical object from storage shelf to public-facing digital image within 24-48 hours.

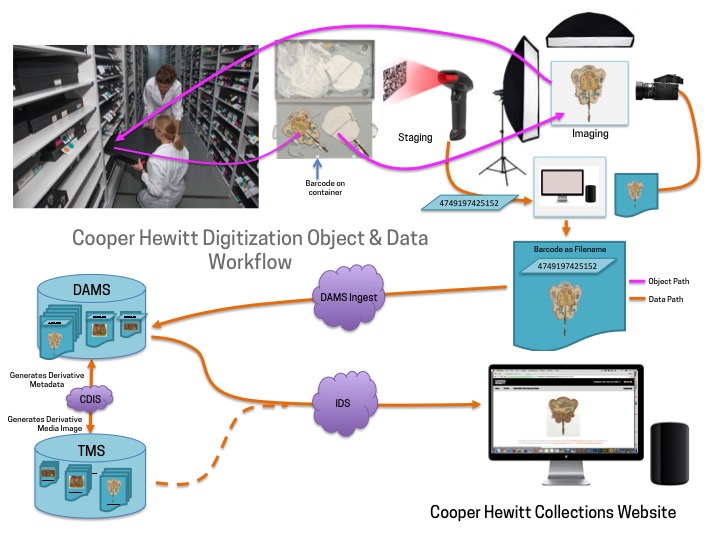
Here is a simplified version of the workflow:

Physical or Object Workflow

  • The vendor’s photographic setup was located in our collections storage facility
  • Art handling technicians pulled pre-organized groups of objects from storage shelves to a staging area
  • A group of objects located on the same shelf or container were carted into the staging area and then placed individually on a photographic set
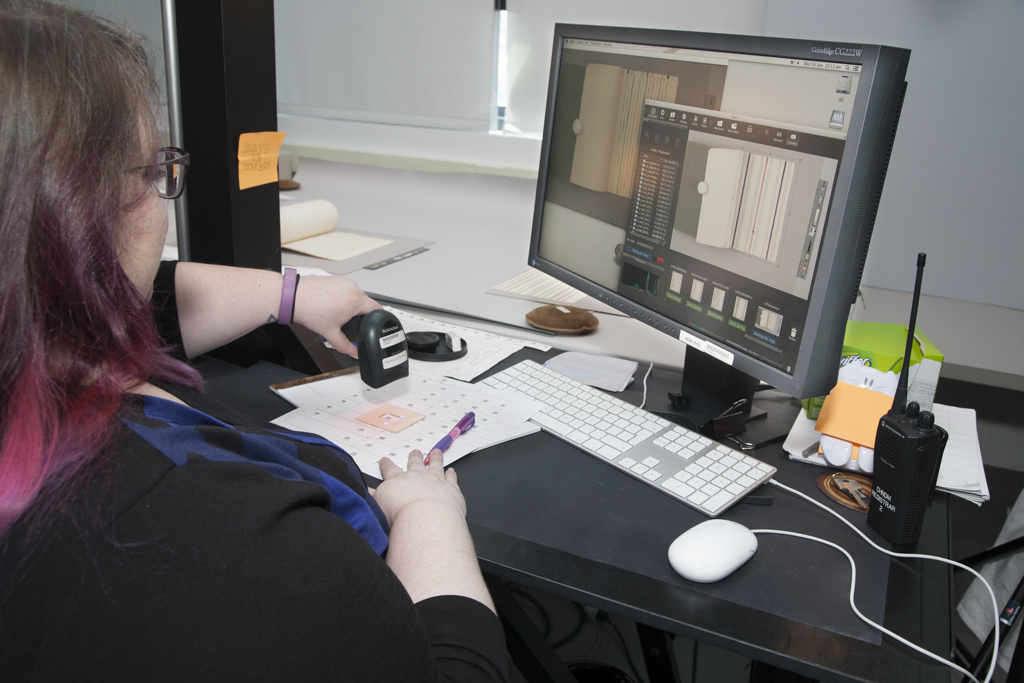
  • The object barcode was scanned to create a file name
  • Photograph is taken
  • Object placed back in the staging area, matched with its barcode tags, and returned to storage

Data Workflow

  • Assets from the project were stored on a production server
  • Museum staff completed daily upload of assets to Smithsonian’s Digital Asset Management System (DAMS)
  • DAMS became the repository for digital assets
  • CDIS (Collection DAMS Integration System) provided synchronization of metadata from TMS, and delivered images to the object records in the collections database, The Museum System
  • IDS (Image Delivery Service) provided public images for use on the Collections Website

Let me repeat the word simplified. Mass digitization applied to uniform collection can be simple, but application to various dimension, size, and materiality was new territory. I will point out some of the challenges that were faced during the process, and the digital innovations that improved efficiency and helped us to complete the process in 18 months.

Barcoding: Bridging the Physical to the Digital

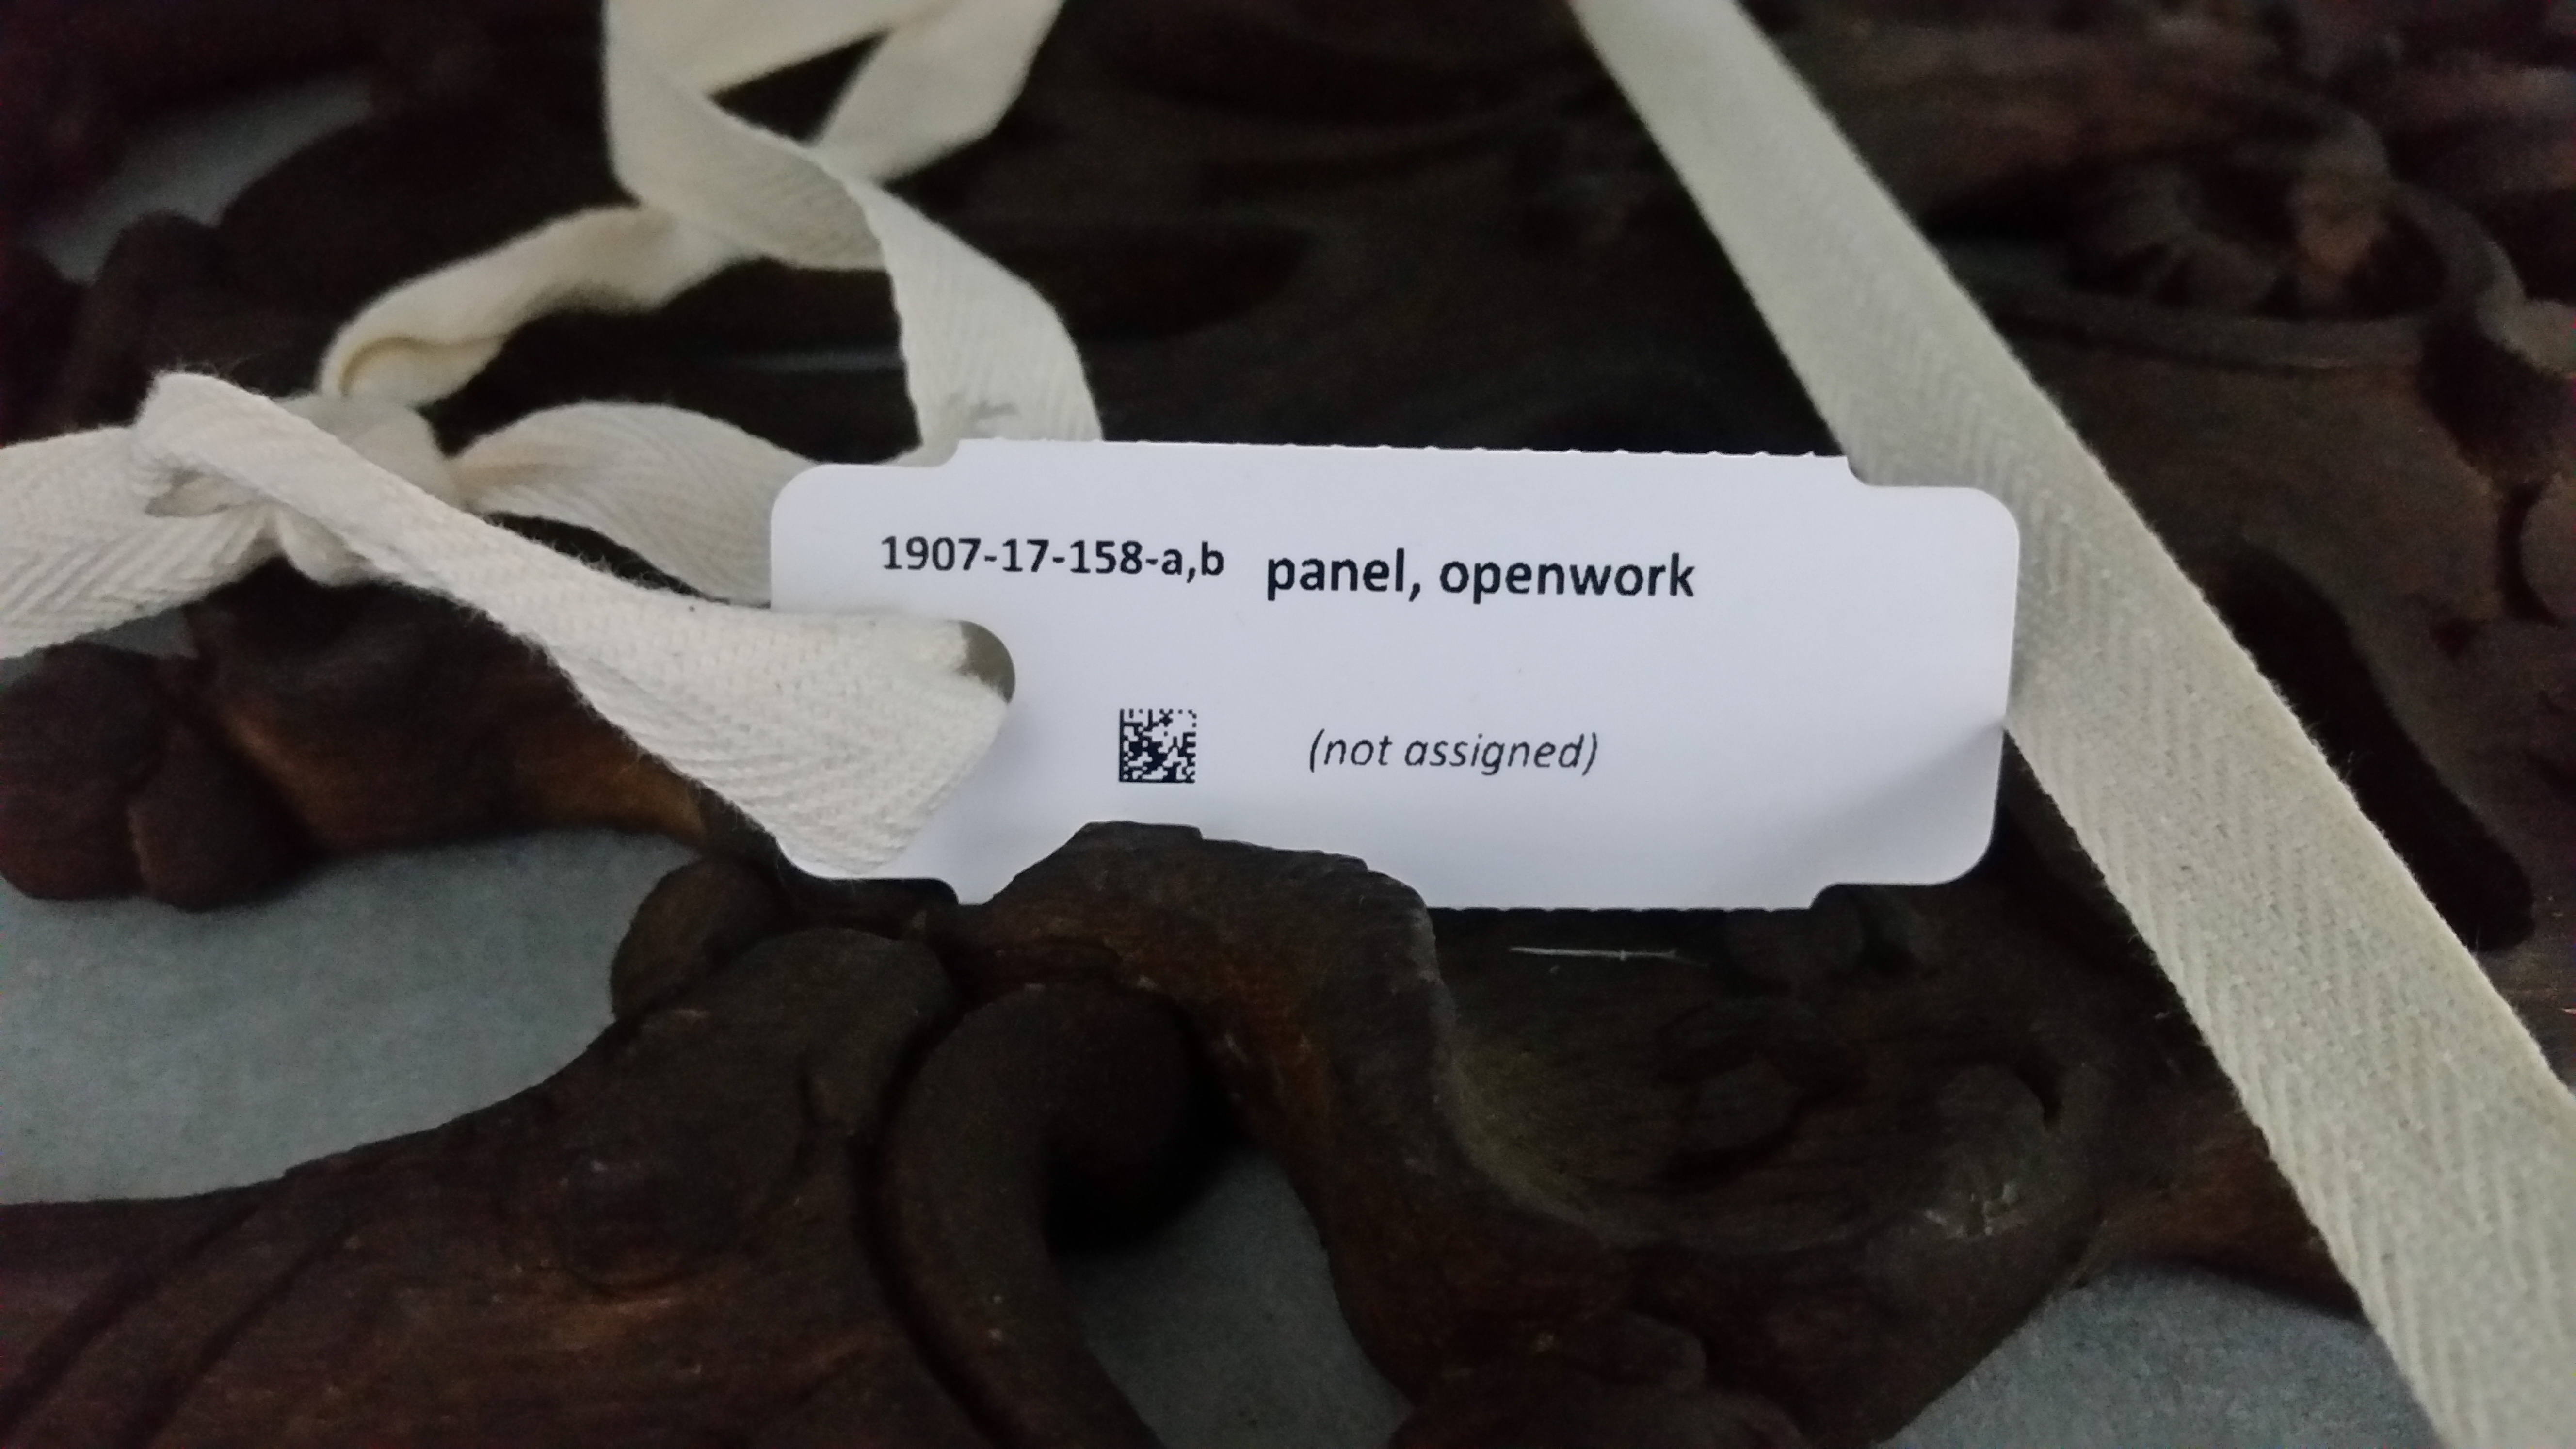
A barcode tag attached to an object in the metalwork sub-collection.

A barcode tag attached to a wooden panel.

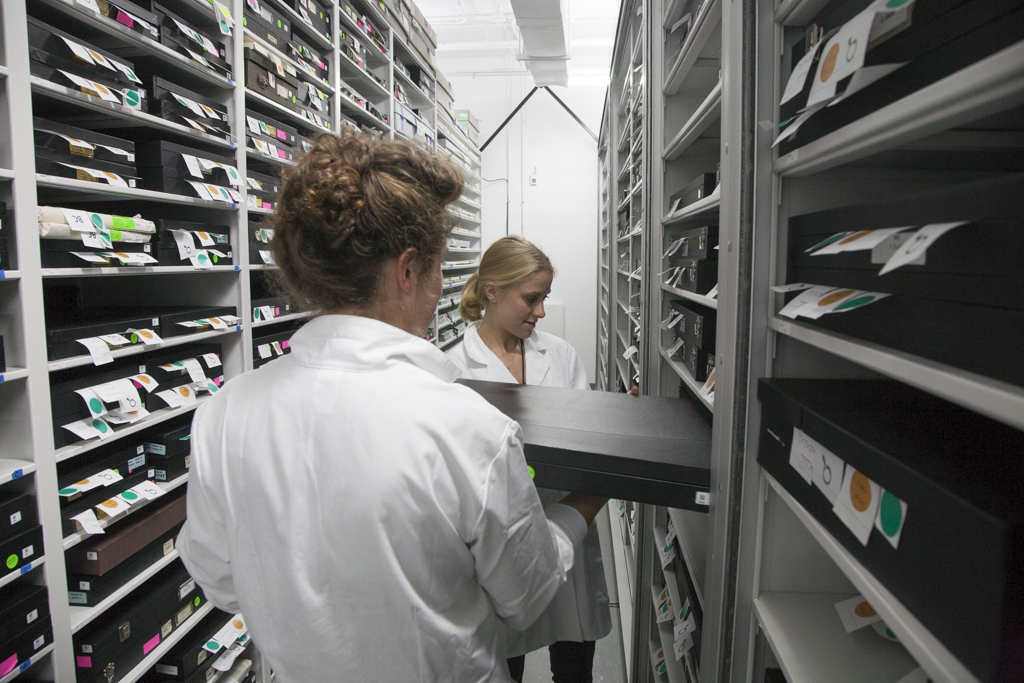
The first stage of digitization was assessment and barcoding of 258,000 objects. Museum objects are categorized in four curatorial departments: Drawings and Prints, Product Design and Decorative Arts, Textiles, and Wallcoverings. A Project Registrar was hired to oversee the barcoding equipment and printing, reconciling object locations, and maintaining a pace for the project. Thirteen barcoding technicians with expertise in object handling and conservation were hired to complete a conservation assessment and barcode each object.

The Museum System, the collections database, contains a barcode number in each object record. This unique identifier was printed as a barcode and affixed to each object. The Registration staff decided that the most efficient way to barcode was not by “cherry picking” random objects, but by systematically working on one shelf or container at a time. A SQL query of a TMS location was used to find all objects on one shelf or in a single container. A software program called Label Matrix would pull, format, and print the query barcodes. A 2-D barcode could be printed as a sticker, for a larger “cover sheet” or as a non-adhesive tag.

Here were some of the challenges:

1. The object’s recorded storage location needed to be accurate

In an ideal workflow, the entire collection would be inventoried before digitization. This would provide accurate locations for each object. Instead, during the barcoding process the technicians were responsible to note any inaccuracies on a spreadsheet. The Project Registrar then reconciled the locations in TMS. The technicians barcoded locations and containers to improve tracking. The barcodes can be differentiated by last number in the sequence: “2” indicates an object, “1” a container, and a location “0”.

2. Objects in storage must be accessible to the digitization technicians

The Product Design and Decorative Arts Department contained sub-collections that were stored in temporary housing. The temporary housing was designed to transport the objects, but not for permanent storage. Conservators and technicians built permanent storage containers that allowed technicians to easily remove and replace objects during digitization. An example of this is the matchsafe sub-collection.

(from left) Match safes packed for travel; Technicians make new containers and barcode objects; Match safes in storage with barcodes in each container and a corresponding coversheet

(from left) Matchsafes packed for travel; Technicians make new containers and barcode objects; Matchsafes in storage with barcodes in each container and a corresponding cover sheet.

3. Objects required special handling due to fragility or component assembly 

The collection contains 211,000 objects. Due to conservation concerns and component assembly, approximately 10 percent of the collection could not be digitized. A visual system was created to alert digitization staff to the conservation “status” of the object: green=ready for digitization, yellow=digitization handling by conservator only, and red=too fragile for digitization. The visual system allowed the vendor staff to work independently in storage, rather than referencing TMS records.

Digitization technicians used the visual system to identify containers ready for imaging.

Digitization technicians used the visual system to identify containers ready for imaging.

4. The barcode needed to be scanned by the reader in a timely manner

A 2-D barcode was used so that the technicians could efficiently scan holding the reader in different positions.

A technician scans a barcode on a coversheet during digitization.

A technician scans a barcode on a coversheet during digitization.

5. The project needed larger organization so that every person involved could plan the timing of digitization

A chart was made to organize the Departments’ sub-collections. An initial count in the TMS database in the sub-collection categories gave an approximate number of items to be digitized. From this number, the Smithsonian’s Digitization Project Office could estimate the digitization rate, a sub-collection schedule, and cost per image. Curators, conservators and digitization staff would meet before the beginning of each sub-collection to decide upon the aesthetic of the images, conservation concerns and handling specifications.

Outcomes:

Object barcoding was a necessary step before the start of digitization. During the imaging workflow, technicians scanned the barcode to input filename. Eliminating the manual entry of filenames saved an average of 14 seconds per file, amounting to 103 working days. It also greatly decreased the rate of human error from manual entry.

The barcode filename became the metadata link between DAMS (Digital Asset Management System) and the collections database TMS. (A good lead-in to my next post!)


Next Post: DAMS and Metadata Mapping!

Slowly improving Copyright clarity

Ever since the online collection first properly went live in 2012 our collection images had a little line under them that said “please don’t steal our images, yeah?”. Whilst it was often commented that this was a friendly, casual approach that felt in keeping with the prevailing winds of the Internet, the statement was purposely vague and, at the end of the day, pretty unhelpful.

screencap-cooper-hewitt-rights.jpg 1,181×570 pixels

After all, “what is ‘stealing’ an image”? “Isn’t the Smithsonian, as a public institution, already owned by the ‘public'”? “What about ‘fair use'”? And, as many pointed out, “why are you claiming some kind of rights over images of objects that are clearly date from before the 20th century?”. Some also spotted the clear disconnect between the ‘please don’t steal’ language and our other visible commitments to open licensing and open source.

First, a bit of history.

The majority of the Cooper Hewitt collection predates its acquisition by the Smithsonian. The collection was originally at Cooper Union until the museum there closed in 1963. It was officially acquired by the Smithsonian in 1968 and the Cooper Hewitt was opened in the Andrew Carnegie Mansion in 1976. The effect of this history is that much of the pre-1968 collection is unevenly documented and its provenance very much still under active research. Post-1976 it is possible to see, in the metadata, the different waves of museum management and collection documentation, as new objects were added to the collection and new collection policies became formalised. Being a ‘new museum’ in 1976 also meant that much of the focus was on exhibitions, not so much on the business of documenting collections. Add to this the rise of computer-based catalogues and you have a very ‘layered’ history.

Cooper Hewitt has not had the resources or staff to undertake the type of multi-year Copyright audits that museums like the V&A have done, and as a result, with provenance and documentation in many cases quite scant, the museum has had to make ‘best efforts’.

With the recent tweaks to the online collection, we have finally been able to make some clarifying changes.

Like all Smithsonian museums, all online content is subject to institution-wide ‘Terms of use‘. This governs the ‘permitted uses’ of anything on our websites, irrespective of underlying rights. These terms are not created at an individual museum level but are part of Smithsonian-wide policy. You can see that whilst these terms allow only ‘allows personal, educational, and other non-commercial uses’ they encourage the use of Fair Use under US Copyright law.

However, that said, we think it is important to be clear on what is definitely out of Copyright, and what may not be. And over time, as the collection gets better documented, more of the unknowns will become known.

So here’s what we have done – its not perfect – but at least its better than it was. And, to be perfectly honest, we’re only talking about the possible rights inherent in the underlying object in the image, as the digital image itself was created by the Smithsonian. Some of the types of object in our collection may not be eligible for Copyright protection in the first place.

For objects from our permanent collection

1. acquired before 1923 then we say “This object has no known Copyright restrictions. You are welcome to use this image in compliance with our Terms of Use.” For example, this medal acquired in 1907.

2. acquired in or after 1923 but has a known creation date [‘end date’ in our collection database] that is before 1923, then we say “This object has no known Copyright restrictions. You are welcome to use this image in compliance with our Terms of Use.” This 1922 textile acquired in 2015 is a good example.

3. acquired in or after 1923 but without a known, documented, creation date [‘end date’ in our collection database], then we say “This object may be subject to Copyright or other restrictions. You are welcome to make fair use of this image under U.S. Copyright law and in compliance with our terms of use. Please note that you are responsible for determining whether your use is fair and for responding to any claims that may arise from your use.” For example this ‘early 20th century’ Indonesian textile.

This scenario is far too common and you will come across objects that clearly appear to be pre-20th century that have not been formally dated, as well as objects that say in their name or description that they are pre-20th century but have not been correctly entered into the database and don’t have their ‘end date’ field completed. An especially egregious example is this 18th century French textile that has incomplete cataloguing. In the collection database it has no ‘end date’ (it should have 1799 as an ‘end date’) and clearly should have no Copyright restrictions.

4. acquired in or after 1923 with a known creation date also in or after 1923 [‘end date’ in our collection database], then we say “This object may be subject to Copyright or other restrictions. You are welcome to make fair use of this image under U.S. Copyright law and in compliance with our terms of use. Please note that you are responsible for determining whether your use is fair and for responding to any claims that may arise from your use.” For example this 2010 wallpaper.

Many of the ‘utilitarian objects’ in our collection – clocks, tables, chairs, much of the product design collection – are legally untested in terms of whether Copyright applies, however in many of these cases other IP protection may apply.

As the US Copyright Office states,

“Copyright does not protect the mechanical or utilitarian aspects of such works of craftsmanship. It may, however, protect any pictorial, graphic, or sculptural authorship that can be identified separately from the utilitarian aspects of an object. Thus a useful article may have both copyrightable and uncopyrightable features. For example, a carving on the back of a chair or a floral relief design on silver flatware could be protected by copyright, but the design of the chair or flatware itself could not. Some designs of useful articles may qualify for protection under the federal patent law.” [source]

For objects on loan from other institutions, companies or individuals

5. irrespective of its known age, we now say “This object may be subject to Copyright, loan conditions or other restrictions”.

As you can see we have had to make some very conservative decisions, largely as a result of the incompleteness of our data and museum records.

If you spot any of these (you could download the entire metadata from Github to programmatically do this), log them with their accession number in our Zendesk and they will be prioritised to be fixed.

Small steps.


—–

Update: Steven Lubar asked us on Twitter to share the number of object records that fall in to each of the categories. Here are those numbers:

Acquired before 1923 32,442
Acquired on or after 1923 and known creation date before 1923 5,232
Acquired on or after 1923 and no known creation date 136,372
Acquired on or after 1923 and known creation date on or after 1923 30,357
Loan objects 13,477

Content sharing and ambient display with Electric Objects EO1

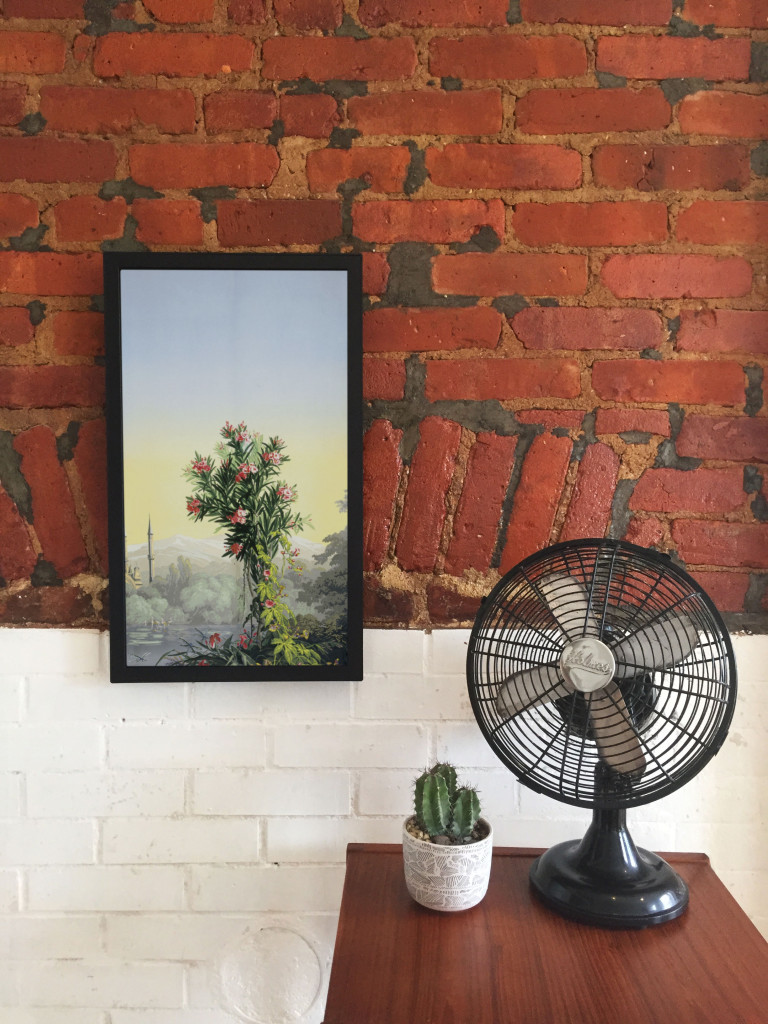
Scenic panel El Dorado, designed by Joseph Fuchs, Eugène Ehrmann and Georges Zipélius and manufactured by Zuber & Cie , 1915-25, Gift of Dr. and Mrs. William Collis. From Cooper Hewitt Collection displayed on an EO1. Photo by Zoe Salditch

Scenic panel El Dorado, designed by Joseph Fuchs, Eugène Ehrmann and Georges Zipélius and manufactured by Zuber & Cie , 1915-25, Gift of Dr. and Mrs. William Collis. From Cooper Hewitt Collection displayed on an EO1. Photo by Zoe Salditch

One of the cornerstones of Cooper Hewitt’s very visible digital strategy has been promiscuity. From the first steps in early 2012 when the online collection was released, we’ve partnered with many people from Google Art Project and Artsy to Artstor and now Electric Objects.

Electric Objects is a little different from the others in that we’ve worked with them to share a very select and small number of collection objects, much in the way that Pam Horn and Chad Phillips have worked to grow the museum’s ‘licensed product’ lines of merchandise.

Electric Objects is a New York startup that raised a significant amount of money on Kickstarter to build and ship a ‘system for displaying digital art’. Jake Levine, Zoe Salditch and their team have now developed the EO1 into a small ecosystem of screens deployed in the homes and offices of about 2500 ‘early adopters’ and digital artists who have been creating bespoke commissions for the system.

Cooper Hewitt joined the New York Public Library in providing a selection of collection materials to see what this community might make of it – and, internally, to think about what it might mean to have a future in which digital art might become ‘ambient’ in people’s homes.

I spoke to Jake and Zoe late last week in their office in New York.

Seb Chan – I like how the EO1 has ‘considered limitations’ – the lack of a slideshow mode, the lack of a landscape mode – can you tell us a bit more about what went into these decisions? And now that EO1s are in homes and offices around the world, what the response has been like?

Jake Levine – Computing has for the last 50 to 60 years been characterized by interaction, generally for the sake of productivity or entertainment. Largely as a result, we’ve built software whose basis for success is defined by volume of interaction. Most companies start with: ‘how often can we get users to engage with our product? ‘

What we’ve been left with is a world filled with software competing for our attention, demanding our interaction. And we feel like crap. We feel overwhelmed.

EO1 was an experiment in a kind of computing that, by definition, could not demand anything from us. We asked whether we could build a computer that brought value into its environment without asking for user interaction. How do we ensure that the experiment remains valid? We make interaction impossible. You can’t ‘use’ EO1, just like you can’t ‘use’ art.

In the interest of exploring a different kind of computing, we made sure not to take any existing software paradigms for granted. The slideshow, of course, is ubiquitous in digital photo frames, to which we are often compared. For that decision, we went back to first principles — why? Why do we want slideshows? My experience with slideshows is characterized by distraction. The image changes, it catches my eye, it interrupts my conversation. Change demands our attention.

We say we want slideshows, but how much of that has to do with expectations informed by how screens have behaved in the past, without enough time spent thinking about how they might behave in the future? We’re so accustomed to the speed of the web, that even while we complain about it, when we’re presented with an alternative, we decide that we miss it.

But what is the value of change on the Internet? For me it’s not about randomness, it’s not about timers and playlists and settings. Change at its most meaningful happens in social contexts, in software that lives on top of a network, where ephemerality is actually just conversation, people talking. Twitter, Facebook, Instagram, Tumblr — these services aren’t an overwhelming flood of information, they are people talking to each other, and that’s why we keep coming back.

So you will likely see change enter the Electric Objects experience in the future, but it won’t be programmatic. It will be social.

Electric Objects, like all networked media discovery software, is a shared experience. And that’s also why we lack landscape. It’s important that everyone experiences Electric Objects in the same way, to create a deeper connection among its members. It also makes for a better user experience.

SC – Defaults matter, I think we all learned that from Flickr, and I really like that EO1 is ‘by default’ Public. This obviously limits the use of the EO1 as a digital photo frame, so what sort of things are you seeing as ‘popular’?

JL – People love water! So many subtly moving water images! But beyond the collective fascination with water, a lot of people are displaying the artwork we’re producing for Art Club, our growing collection of new and original art made for EO1 (including the awesome collection of wallpaper from Cooper Hewitt!).

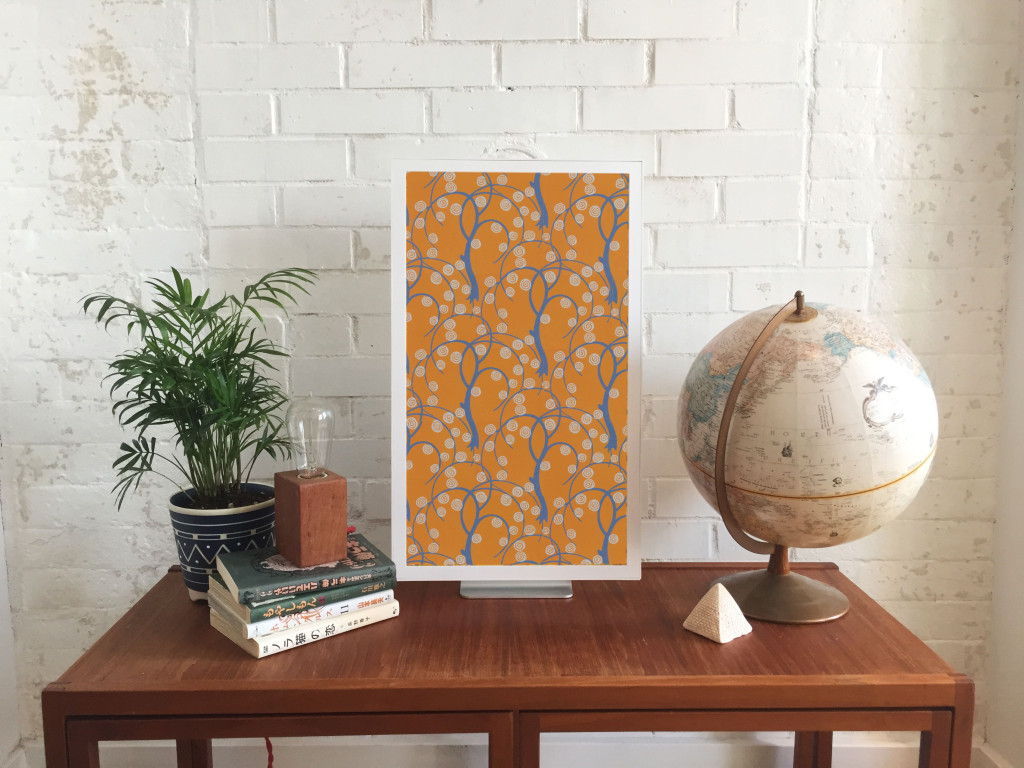
Sidewall, wallpaper with stylized trees, ca 1920, designed by René Crevel and manufactured by C. H. H. Geffroy and distributed by Nancy McClelland, Inc. From Cooper Hewitt Collection displayed on an EO1. Photo by Zoe Salditch.

Sidewall, wallpaper with stylised trees, ca 1920, designed by René Crevel and manufactured by C. H. H. Geffroy and distributed by Nancy McClelland, Inc. Gift of Nancy McClelland. From Cooper Hewitt Collection displayed on an EO1. Photo by Zoe Salditch.

SC – Cooper Hewitt joined the Art Club early on and we’re excited to see a selection of our historic wallpapers available on the device. This wasn’t as straight forward as any of us had expected, though. Can you tell us about the process of getting our ‘digitised wallpapers’ ready and prepared for the EO1?

JL – When you’re bringing any art onto a screen, you have to deal with a fixed aspect ratio. Software designers and engineers know the pain of accommodating varying screen sizes all too well. In many ways what we offer artists — a single aspect ratio across all of our users — is a welcome relief. What’s more challenging is “porting” existing work into the new dimensions.

Wallpapers were actually a great starting point, because they’re designed to be tiled. Still, we hand cropped and tiled each object, to ensure an optimal experience for the user (and the art!).

SC – Our friends at Ghostly and NYPL took a slightly different route. Can you tell us about how both of those collaborators chose and supplied the works that they have made available?

JL – Ghostly is a label that represents a fantastic group of artists and musicians. Together, we selected a few artists to participate in the Ghostly x EO collection, featuring original work made specifically for Electric Objects.

And NYPL was somewhere between Ghostly and what we did with Cooper Hewitt. NYPL has this incredible collection of maps that they’ve digitized. We knew we didn’t want to simply show a cropped version of the maps on EO1, so we turned to the artist community, and starting taking proposals. We asked: what would you do with these beautiful maps as source material?

Natural Elements by Jenny Oddell from the NYPL x EO Collection

Natural Elements by Jenny Oddell from the NYPL x EO Collection

Jenny Odell produced an incredible series of collages. She spent ninety-two hours cutting out the illustrations that cartographers often include on the edges of the maps in photoshop — these beautiful illustrations that rarely get any attention since the maps have a primarily functional purpose. In this case we used something old to make something new, something designed with and for the screen. It was perfect.

SC – Art Club feels like it could be sort of a ‘Bandcamp for net art’. I know you’ve been commissioning specific works for the EO1 and making sure artists get paid, so tell us more about how you see this might work in the future?

Zoe Salditch – Without art, EO1 would just be any other screen. And we’ve known since the early days that art made for EO1 is always a better experience.

There are many ways people engage with and have historically paid for art, so we’re exploring a couple different ideas. Right now, we commission artists upfront and ask them to create small series for EO1, and this collection is available for free for EO1 owners for now. Our plan is to eventually put this ever-growing collection behind a subscription, so that the customer can subscribe to gain access to the entire collection.

Other strategies we’re exploring include limited editions, and a commission service for those who want to have something that feels more exclusive and custom. We believe that artists should be paid for their work, and that people will pay for great art. Other than that, we’re open to experimenting, and we have a lot to learn from our community now that EO1 is out in the wild!

SC – Cooper Hewitt’s wallpapers have been up for a little while as you’ve been shipping out units to Kickstarter backers. What can you tell us about how people have been showing them? What sorts of stats are we looking at?

JL – Art from the Cooper Hewitt collection has been displayed 783 times in homes all over the world, with an aggregate on-display time of over 217 days! The three El Dorado scenic panels have been most popular!

Explore the Cooper Hewitt objects available for ambient viewing through Electric Objects, to visit Shop Cooper Hewitt in-store at 2 East 91st in New York to buy an EO1 unit from the museum tax-free [sorry, not currently available via our online store].

Long live RSS

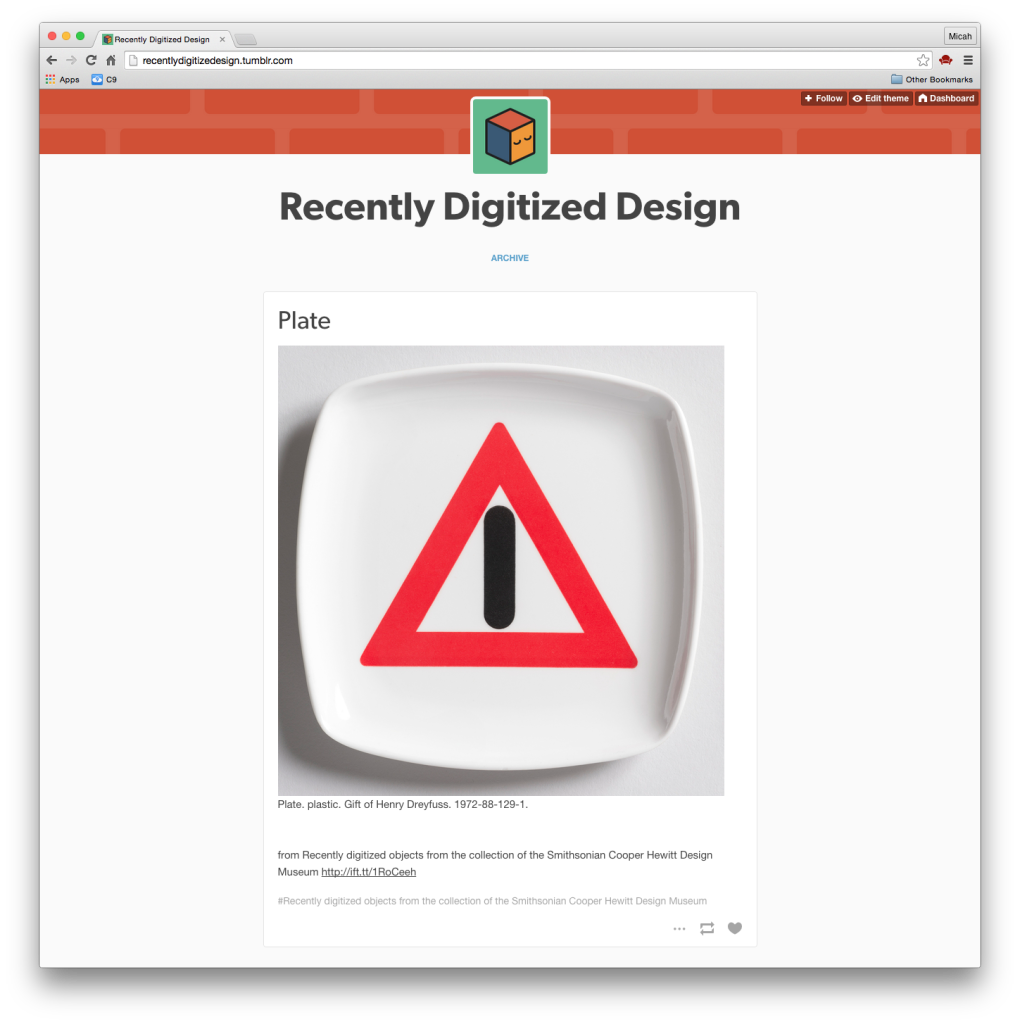
Screen Shot 2015-07-10 at 2.35.17 PM

I just made a new Tumblr. It’s called “Recently Digitized Design.” It took me all of five minutes. I hope this blog post will take me all of ten.

But it’s actually kinda cool, and here’s why. Cooper Hewitt is in the midst of mass digitization project where we will have digitized our entire collection of over 215K objects by mid to late next year. Wow! 215K objects. That’s impressive, especially when you consider that probably 5000 of those are buttons!

What’s more is that we now have a pretty decent “pipeline” up and running. This means that as objects are being digitized and added to our collections management system, they are automatically winding up on our collections website after winding their way through a pretty hefty series of processing tasks.

Over on the West Coast, Aaron, felt the need to make a little RSS feed for these “recently digitized” so we could all easily watch the new things come in. RSS, which stands for “Rich Site Summary”, has been around forever, and many have said that it is now a dead technology.

Lately I’ve been really interested in the idea of Microservices. I guess I never really thought of it this way, but an RSS or ATOM feed is kind of a microservice. Here’s a highlight from “Building Microservices by Sam Newman” that explains this idea in more detail.

Another approach is to try to use HTTP as a way of propagating events. ATOM is a REST-compliant specification that defines semantics ( among other things ) for publishing feeds of resources. Many client libraries exist that allow us to create and consume these feeds. So our customer service could just publish an event to such a feed when our customer service changes. Our consumers just poll the feed, looking for changes.

Taking this a bit further, I’ve been reading this blog post, which explains how one might turn around and publish RSS feeds through an existing API. It’s an interesting concept, and I can see us making use of it for something just like Recently Digitized Design. It sort of brings us back to the question of how we publish our content on the web in general.

In the case of Recently Digitized Design the RSS feed is our little microservice that any client can poll. We then use IFTTT as the client, and Tumblr as the output where we are publishing the new data every day. 

RSS certainly lives up to its nickname ( Really Simple Syndication ), offering a really simple way to serve up new data, and that to me makes it a useful thing for making quick and dirty prototypes like this one. It’s not a streaming API or a fancy push notification service, but it gets the job done, and if you log in to your Tumblr Dashboard, please feel free to follow it. You’ll be presented with 10-20 newly photographed objects from our collection each day.

UPDATE:

So this happened: https://twitter.com/recentlydigital

Sorting, Synonyms and a Pretty Pony

We’ve been undergoing a massive rapid-capture digitization project here at the Cooper Hewitt, which means every day brings us pictures of things that probably haven’t been seen for a very, very long time.

As an initial way to view all these new images of objects, I added “date last photographed” to our search index and allowed it to be sorted by on the search results page.

That’s when I found this.

[collection_object id=18692335]

I hope we can all agree that this pony is adorable and that if there is anything else like it in our collection, it needs to be seen right now. I started browsing around the other recently photographed objects and began to notice more animal figurines:

[collection_object id=18460201]

[collection_object id=18615463]

As serendipitous as it was that I came across this wonderful collection-within-a-collection by browsing through recently-photographed objects, what if someone is specifically looking for this group? The whole process shows off some of the work we did last summer switching our search backend over to Elasticsearch (which I recently presented at Museums and the Web). We wanted to make it easier to add new things so we could provide users (and ourselves) with as many “ways in” to the collection as possible, as it’s those entry points that allow for more emergent groupings to be uncovered. This is great for somebody who is casually spending time scrolling through pictures, but a user who wants to browse is different from a user who wants to search. Once we uncover a connected group of objects, what can we do to make it easier to find in the future?

Enter synonyms. Synonyms, as you might have guessed, are a text analysis technique we can use in our search engine to relate words together. In our case, I wanted to relate a bunch of animal names to the word “animal,” so that anyone searching for terms like “animals” or “animal figurines” would see all these great little friends. Like this bear.

[collection_object id=18633719]

The actual rule (generated with the help of Wikipedia’s list of animal names) is this:

 "animal => aardvark, albatross, alligator, alpaca, ant, anteater, antelope, ape, armadillo, baboon, badger, barracuda, bat, bear, beaver, bee, bird, bison, boar, butterfly, camel, capybara, caribou, cassowary, cat, kitten, caterpillar, calf, bull, cheetah, chicken, rooster, chimpanzee, chinchilla, chough, clam, cobra, cockroach, cod, cormorant, coyote, puppy, crab, crocodile, crow, curlew, deer, dinosaur, dog, puppy, salmon, dolphin, donkey, dotterel, dove, dragonfly, duck, poultry, dugong, dunlin, eagle, echidna, eel, elephant, seal, elk, emu, falcon, ferret, finch, fish, flamingo, fly, fox, frog, gaur, gazelle, gerbil, panda, giraffe, gnat, goat, sheep, goose, poultry, goldfish, gorilla, blackback, goshawk, grasshopper, grouse, guanaco, fowl, poultry, guinea, pig, gull, hamster, hare, hawk, goshawk, sparrowhawk, hedgehog, heron, herring, hippopotamus, hornet, swarm, horse, foal, filly, mare, pig, human, hummingbird, hyena, ibex, ibis, jackal, jaguar, jellyfish, planula, polyp, scyphozoa, kangaroo, kingfisher, koala, dragon, kookabura, kouprey, kudu, lapwing, lark, lemur, leopard, lion, llama, lobster, locust, loris, louse, lyrebird, magpie, mallard, manatee, mandrill, mantis, marten, meerkat, mink, mongoose, monkey, moose, venison, mouse, mosquito, mule, narwhal, newt, nightingale, octopus, okapi, opossum, oryx, ostrich, otter, owl, oyster, parrot, panda, partridge, peafowl, poultry, pelican, penguin, pheasant, pigeon, bear, pony, porcupine, porpoise, quail, quelea, quetzal, rabbit, raccoon, rat, raven, deer, panda, reindeer, rhinoceros, salamander, salmon, sandpiper, sardine, scorpion, lion, sea urchin, seahorse, shark, sheep, hoggett, shrew, skunk, snail, escargot, snake, sparrow, spider, spoonbill, squid, calamari, squirrel, starling, stingray, stinkbug, stork, swallow, swan, tapir, tarsier, termite, tiger, toad, trout, poultry, turtle, vulture, wallaby, walrus, wasp, buffalo, carabeef, weasel, whale, wildcat, wolf, wolverine, wombat, woodcock, woodpecker, worm, wren, yak, zebra"

Where every word to the right of the => automatically gets added to a search for a word to the left.

Not only does our new search stack provide us with a useful way to discover emergent relationships, but it makes it easy for us to “seal them in,” allowing multiple types of user to get the most from our collections site.

Video Capture for Collection Objects

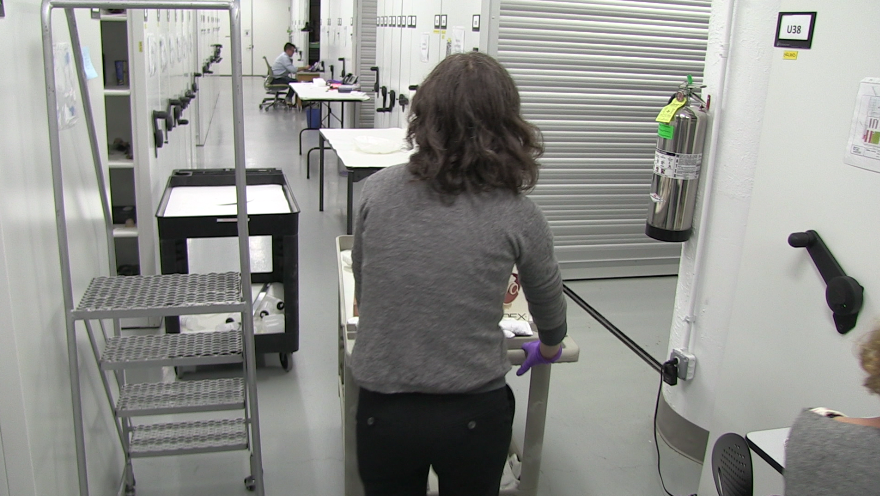
Stepping inside a museum storage facility is a cool experience. Your usual gallery ambience (dramatic lighting, luxurious swaths of empty space, tidy labels that confidently explain all) is completely reversed. Fluorescent lights are overhead, keycode entry pads protect every door, and official ID badges are worn by every person you see. It’s like a hospital, but instead of patients there are 17th century nightgowns and Art Deco candelabras. Nestled into tiny, sterile beds of acid-free tissue paper and archival linen, the patients are occasionally woken and gently wheeled around for a state-of-the-art microscope scan, an elaborate chemical test, or a loving set of sutures.

A gloved, cardigan-ed museum worker pushing a rolling cart down a hallway of large white shelving units.

A rare peek inside the storage facility.

If you ask a staff member for an explanation of this or that object on the nearest cart or shelf, they might tell you a detailed story, or they might say that so far, not much is known. I like the element of unevenness in our knowledge, it’s very different from the uniform level of confidence one sees in a typical exhibition.

The web makes it possible to open this space to the public in all its unpolished glory – and many other museums have made significant inroads into new audiences by pulling back the curtain. The prospect is like catnip for the intellectually curious, but hemlock for most museum employees.

Typically, the only form of media that escapes this secretive storage facility are hi-res TIFFs artfully shot in an on-site photography studio. The seamless white backdrop and perfectly staged lighting, while beautiful and ideal for documentation, completely belie the working lab environment in which they were made.

We just launched a new video project called “Collections in Motion.” The idea is super simple: short videos that demonstrate collections objects that move, flip, click, fold, or have any moveable part.

Here are some of the underlying thoughts framing the project:

  • Still images don’t suffice for some objects. Many of them have moving parts, make sounds, have a sense of weight, etc that can’t be conveyed through images.
  • Our museum’s most popular videos on YouTube are all kinetic, kinda entrancing, moving objects. (Contour Craft 3D Printing, A Folding Bicycle, and a Pop-up Book, for example).
  • Videos played in the gallery generally don’t have sound or speakers available.
  • In research interviews with various types of visitors, many people said that they wouldn’t be interested in watching a long, involved video in a museum context.
  • Animated GIFs, 6-second Vines, and 15-second Instagram videos loom large in our contemporary visual/communication culture.
  • How might we think of the media we produce (videos, images, etc) as a part of an iterative process that we can learn from over time? Can we get comfortable with a lower quality but higher number of videos going out to the public, and seeing what sticks (through likes, comments, viewcount, etc)?


A screenshot from YouTube Analytics showing most popular videos: Contour Crafting, Folding Bicycle, Puss in Boots Pop-up book, et cetera

Our most popular YouTube videos for this quarter. They are all somewhat mesmerizing/cabinet-of-curiosity type things.

Here are some of the constraints on the project:

  • No budget (pairs nicely with the preceding bullet).
  • Moving collections objects is a conservation no-no. Every human touch, vibration and rub is bad for the long-long-longevity of the object (and not to mention the peace of mind of our conservators).
  • Conservators’ and curators’ time is in HIGH demand, especially as we get closer to our re-opening. They are busy writing new books, crafting wall labels, preparing gallery displays, etc. Finding a few hours to pull an object from storage and move it around on camera is a big challenge.

So, nerd world, what do you think?

Exploring quickly made 3D models of the mansion

Restoring the Carnegie Mansion which provides the shell in which Cooper-Hewitt resides, gives a fantastic opportunity to test some 3D scanning. So in the latter part of 2012 we started exploring some of the options.

One local startup, Floored.com, came to do a test scan of our freshly restored National Design Library. In just 15 minutes their Matterport camera had scanned the room and their servers were generating a navigable 3D model. This is much more than a 360 panorama, it is a proper 3D model, and one that could, with more clean up be used for exhibition design purposes as much as general playfulness.

3d-library-floored

We’re pretty excited to see what is becoming possible with quick scanning. Whilst these models aren’t high enough resolution right now, the trade off between speed and quality is becoming less and less every year.

We’re sharing this, too, because of the way the unmasked mirror in the scan has created a ‘room that isn’t there’. It would be a good place to hide treasure if the 3D model ever ended up in a game engine.

Go have an explore.