Category Archives: CH 3.0

Rebooting Museum Publishing

For over two years, much to many people’s surprise, Cooper Union Museum’s and Cooper-Hewitt’s historical publications have been publicly accessible via the Internet Archive. Many of these publications are rare and in some cases, the only known existing copy is held in our National Design Library who worked hard to have them digitized. Sadly, these long digitized Museum publications have languished without much visibility.

In fact, in The New York Times’ 11/26/12 piece “The Art World, Blurred”, Carol Vogel identifies the “graveyard of out-of-print books” that is rapidly haunting museums. In shout-outs to these savvy go-getters, she cheers for a long list of online museum initiatives at the Metropolitan Museum of Art, the Walker Art Center in Minneapolis, LACMA, and the Art Institute of Chicago, to name a few. Can anyone say Cooper-Hewitt?

Thankfully, all that is changing!

With our Historical Publications section, this material is now easily accessible and can be explored right on the page without leaving the site. In addition, integrating these publications on our site provides a growing connection with the Museum collection and exhibition archive, while also establishing an invaluable foundation as the Museum moves into new publishing territory. Expect to see rich connections to and from our evolving Online Collections soon

Publishing is experiencing a renaissance at Cooper-Hewitt, led by the newly-formed Cross-Platform Publishing team now part of Digital and Emerging Media. We are particularly excited about our new imprint, DesignFile, which was created to publish ebooks on design research and writing. Design Cult, a collection of essays by design critic and National Design Award winner, Steven Heller, will be one of three DesignFile releases set to launch in January 2013. Look for it in epub , iBooks, and Kindle. Spoiler alert: there will be an upcoming post offering some cool insights from our in-house graphic designer, Katie, about the process of designing covers for ebooks vs. print.

We have more projects underway—including a rethinking of publishing workflows much in the vein of Auckland Museum’s ‘COPE’ strategy (create once publish everywhere).

In the meantime, check out one of our favorite historical pubs, the 1941 A Brief Introduction to the Museum’s Facilities, which is a fascinating glimpse into both mid-20th-century design thinking and the museum experience.

Pam Horn & Sara Rubinow

Being 'Of The Web': now with Behance, Lanyrd & Art.sy

Last week we talked about our philosophy of being ‘of the web‘, rather than just having the museum ‘on the web’.

And so onto our latest partnerships, our stepping stones to make this a reality.

Behance

We’ve worked with Behance, to deepen the exposure of the National Design Award winners through the creation of a branded gallery on their platform.

Rather than the museum making (another) microsite, Behance offers us a way to put the award winners into one of the largest professional social networks used by designers themselves. You can now browse projects by the winners, finalists and jurors – all within their platform.

Behance brings huge exposure to the winners, and the awards, and we’re expecting that many more people find out about the awards than would ever have made it to our own site.

Lanyrd

And we’ve partnered with event calendaring Lanyrd to highlight design events across America this month. Lanyrd offers a branded site for National Design Week, and, at the backend, has allowed us, in the words of Aaron Cope, ‘to get out of the calendaring business’ (which museums shouldn’t ever be part of!). Aaron’s also been able to whip up a nice little mobile web app – helped by the normalisation of the data feed provided by Lanyrd. (App post soon!)

Art.sy

You already know we are one of the larger contributors to Google Art Project, and now we’ve also contributed to another pan-institutional project, Art.sy. I’m excited by this because it challenges Art.sy’s ‘art genome‘ tools to deal with a design collection. And also because the site itself very publicly reveals the porous boundaries between the art market and the art museum.

Read the New York Times piece on Art.sy which quite nicely demonstrates the subtle rift between the old (on the web) and new (of the web) worlds.

And . . .

And finally, you might notice that if you happen put the URL of one of our collection objects in a tweet, you get a nice little ‘expanded’ bit of information, complete with object thumbnail and @cooperhewitt attribution! That was Aaron’s Friday afternoon treat. Next stop is a custom short URL to make that whole process a bit nicer on the eyes. Cool, huh?

Getting lost in the collection (alpha)

Last week marked a pretty significant moment in my career here at Cooper-Hewitt.

As I’m sure most of you already know, we launched our Alpha collections website. The irony of this being an “alpha” of course is that it is by leaps and bounds better than our previous offering built on eMuseum.

If you notice in the screengrab below, eMuseum was pretty bland. The homepage, which is still available allowed you to engage by selecting from one of 4 museum oriented departments. You could also search. Right…

Upon entering the site, either via search or through browsing one of the four departments several things were in my mind huge problems.

Above is a search for “lennon” and you get the idea. Note the crazy long URLs with all kinds of session specific data. This was for years a huge issue as people would typically copy and paste that URL to use in blog posts and tweets. Trying to come back to the same URL twice never worked, so at some point we added a little “permlink” link at the bottom, but users rarely found it. You’ll also note the six search options under the menu item “Search.” OK, it’s just confusing.

Finally landing on an object page and you have the object data, but where does it all lead you to?

For me the key to a great, deep, user experience is to allow users to get lost within the site. It sounds odd at first. I mean if you are spending your precious time doing research on our site, you wouldn’t really want to “get lost” but in practice, it’s how we make connections, discover the oddities we never knew existed, and actually allow ourselves to uncover our own original thought. Trust me, getting lost is essential. (And it is exactly what we know visitors enjoy doing inside exhibitions.)

As you can probably tell by now, getting lost on our old eMuseum was pretty tough to do. It was designed to do just the opposite. It was designed to help you find “an object.”

Here’s what happens when you try to leave the object page in the old site.

So we ditched all that. Yes, I said that right, we ditched eMuseum! To tell you the truth, this has been something I have been waiting to do since I started here over two years ago.

When I started here, we had about 1000 objects in eMuseum. Later we upped that to 10,000, and when Seb began (at the end of 2011) we quickly upped that number to about 123,000.

I really love doing things in orders of magnitude.

I noticed that adding more and more objects to eMuseum didn’t really slow it down, it just made it really tough to browse and get lost. There was just too much stuff in one place. There were no other entry points aside from searching and clicking lists of the four departments.

Introducing our new collections website.

We decided to start from scratch, pulling data from our existing TMS database. This is the same data we were exporting to eMuseum, and the same data we released as CC0 on GitHub back in February. The difference would be, presenting the data in new ways.

Note the many menu options. These will change over time, but immediately you can browse the collection by some high level categories.

Note the random button–refreshing your browser displays three random objects form our collection. This is super-fun and to our surprise has been one of the most talked about features of the whole alpha release. We probably could have added a random button to eMuseum and called it a day, but we like to aim a little higher.

Search is still there, where it should be. So let’s do a similar search for “lennon” and see what happens.

Here, I’ve skipped the search results page, but I will mention, there were a few more results. Our new object page for this same poster by Richard Avedon is located at the nice, friendly and persistent URL https://collection.cooperhewitt.org/objects/18618175/. It has its own unique ID (more on this in a post next week by Aaron) and I have to say, looks pretty simple. We have lots of other kinds of URLs with things in them like “people” , “places” and “periods.” URLs are important, and we intend to ensure that these live on forever. So, go ahead and link away.

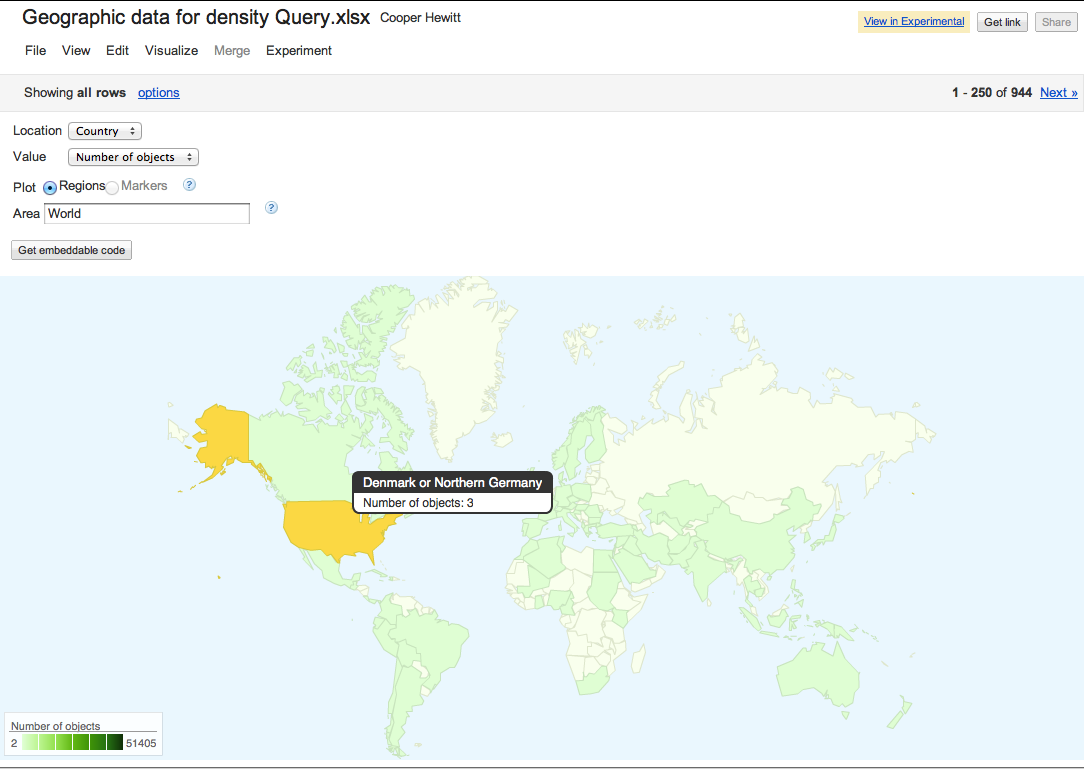
The basic page layout is pretty similar to eMuseum, at first. You have essential viatal stats in the gray box on the right. Object ID, Accession Number, Tombstone data, etc, etc. You also have a map, and some helpful hints.

But then things get a little more exciting. We pull in loads of TMS data, crunch it and link it up to all sorts of things. Take a scroll down this page and you’ll see lots of text, with lots of links and a few fun bits at the end, like our “machine tag” field.

Each object has been assigned a machine tag based on its unique ID number. This is simple and straightforward future-proofing. If you’re on a site like Flickr and you come across (or have your own) photo of the same object we have in our collection, you can add the machine tag.

Some day in the near future we will write code to pull in content tagged in this way from a variety of sources. This is where the collection site will really begin to take shape as well not only be displaying the “thing we have” but its relevance in the world.

It puts a whole new spin on the concept of “collecting” and it’s something we are all very excited to see happen. So start tagging!

Moving on, I mentioned that you can get lost. This is nice.

From the Avedon poster page I clicked on the decade called 1960’s This brings me to a place where I can browse based on the decade. You can jump ahead in time and easily get lost. It’s so interesting to connect the object you are currently looking at to others from the same time period. You immediately get the sense that design happens all over the world in a wide variety of ways. It’s pretty addictive.

Navigating to the “person” page for Richard Avedon, we begin to see how these connections can extend beyond our own institutional research. We begin by pointing out what kinds of things we have by Avedon. This is pretty straight-forward, but in the gray box on the right you can see we have also linked up Avedon’s person record in our own TMS database with a wide variety of external datasets. For Avedon we have concordances with Freebase, MoMA, the V & A, and of course Wikipedia. In fact, we are pulling in Wikipedia text directly to the page.

In future releases we will connect with more and more on the web. I mean, thats the whole point of the web, right? If you want to help us make these connections ( we cant do everything in code ) feel free to fork our concordances repository on GitHub and submit a pull request.

We have many categorical methods of browsing our collection now. But I have to say, my favorite is still the Random images on the home page. In fact I started a Pinterest board called “Random Button” to capture a few of my favorites. There are fun things, famous things, odd things and downright ugly things, formerly hidden away from sight, but now easy to discover, serendipitously via the random button!

There is much more to talk about, but I’ll stop here for now. Aaron, the lead developer on the project is working on a much more in depth and technical post about how he engineered the site and was able to bring us to a public alpha in less than three months!

So stay tuned…. and get exploring.

Webcasting on the go

As we travel around the city doing panels and talks everywhere from Governors Island to the United Nations to our Design Center in Harlem, we’re always webcasting. Lots of people have looked at our setup by now and have approached us with questions– what’s our equipment of choice? How do we make it all portable?  What services do we use? What’s that funny plug thing?

Here’s our secret recipe:

YouTube Live Service (you need to be a YouTube Partner for this). Ustream is an alternative service if you can’t get partnership status, we used to use Ustream before we were invited to be guinea pigs in the very awesome YouTube Live Beta Launch last year.

YouTube live is new & awesome

which pulls streaming data from us via…

WireCast for YouTube (free software if you have YouTube Live) Regular Wirecast software is a paid alternative if you can’t get YouTube partner status.

installed on a…

Macbook Air with Thunderbolt port

plugged in to a…

Thunderbolt male to male cable

plugged in to a…

BlackMagic intensity shuttle with Thunderbolt

plugged in to a…

HDMI male to male cable

plugged in to a…

Canon XF105 camera with HDMI-out port

which is receiving audio from…

An XLR cable which carries the audio from any number of stick mics fed into our mixing board & XLR splitter. If we’re in an auditorium venue we ask for an XLR feed from the AV people there.

HDMI is awesome (image via howstuffworks.com)


Notes:

The HDMI cable carries both audio AND video from the camera into the laptop. SWEET.

Wi-fi works fine, unbelievably. But a hard wired connection is always best for streaming if you can get it.

Sometimes if your audio and video sources are separate from each other, the webcast will appear out of sync. Sending A and V together through one camera is good for sync.

We tried playing with multi-cam a few times (on a mac pro tower, wouldn’t dare that with a laptop graphics card) This usually choked the graphics card, and gave us sync issues. So we stick to single-cam.

Sometimes we run our own camera and our own mixing board with microphones, and sometimes we’re in a venue where microphones are done by the house staff, and we just ask them for an XLR feed which we plug into our camera.

The UN and WNYC Greene Space house staff ran their own camera and audio, AND they had their own streaming encoder. In this scenario we give them the RTMP and Stream Name codes (stored in the YouTube event settings) from our YouTube account. They plugged these codes into their encoder software–making a direct link between the venue’s audio and video feeds and our YouTube account. In these cases, our only job is to check that the A and V signals are coming through to the net OK, and then clicking “Start Broadcast” on YouTube in a web browser. Then after the program is done I click “Stop Broadcast.”

Every venue will have different hardware and software going on, so this setup can take some major fiddling with settings before you get it to work. Generally this fiddling has to happen with the venue’s encoder software, because the YouTube settings stay pretty static. The UN’s encoder was robust enough that they could push the stream to their usual flash player on the UN web site and our YouTube account simultaneously.

Here’s what the media team at the Walker Art Center has to say about webcasting. We’ll move to a setup more like theirs once our main Museum renovation is done, and we have a permanent home for programming. For now, we’re webcasting in a way that’s light, modular and mobile.

Designing the responsive footer

We now have a responsive main website. To a degree.

Like everything it is a stopgap measure before we do a full overhaul of the Cooper-Hewitt online – timed to go live before we reopen our main campus (2014).

With the proportion of mobile traffic to our web properties increasing every month we couldn’t wait for a full redesign to implement a mobile-friendly version of the site. So we did some tweaking and with the help of Orion, pulled responsiveness into the scope for a migration of backends from Drupal 6 to Drupal 7.

Katie did the wireframing and design of the new funky fat footer – which you’ll notice, changes arrangements as it switches between enormous (desktop), large (tablet) and mini (mobile) modes.

Here she is explaining the what and why.

Why did you do paper prototypes for the responsive design?

A few months ago I was working on a design for the Arts Achieve website. I showed my screen to Bill, our museum director, to get his thoughts. Bill is a former industrial designer and one of the pioneers of interaction design. The first thing he said was “ok, let’s print out a screenshot.” He then drew his suggestions right onto the printed page. We didn’t really look at the screen much during the conversation. Writing directly onto the paper was more immediate and direct, and made his suggestions feel very possible to me. Looking at a site design on a screen makes me feel like I’m looking at something final, even if its just a mockup. The same thing printed on paper seems more malleable. It’s a mind trick!

Paper also lets me print out many versions and compare them side-by-side (you can’t do that on a single monitor).

Paper also ALSO lets me walk around showing my print-outs to others and ask for rapid reactions without pulling everyone into a screen hover session. This is a simple body/communication thing: when everyone is facing toward a screen to talk about a design, you’re not in a natural conversational position. Everyone’s face and body is oriented toward the screen. I can’t see people’s faces and expressions unless I twist around. When you’re just holding a paper, and there’s no screen, it’s more like a natural conversation.

Post-its stuck to the monitor as a way to quickly agree on our initial ideas

Why do some of the elements move around in the responsive footer? (why do the icons and signups move)

They move around to be graphically pleasing. And to make sure the stuff we wanted people to notice and click on is most prominent.

We had a strong desire for the social media icons to be really prominent. So they’re front and center in the monitor-width design (940px width). They’re on the right hand side in the tablet-size design (700px wide) and in the mobile-size design (365px wide) because I think it looks sharpest when the rectilinear components are left-justified and the round stuff is on the right.

What were the challenges for the responsive design?

We had a really clear hierarchy in mind from the beginning (we knew what we really wanted people to notice and click) so that eliminated a lot of complexity. The only challenge was how to serve that hierarchy cleanly.

One challenge was the footer doesn’t always graphically harmonize with the body of the page, because the page content is always changing.

Another challenge was getting the latest tweet to be clear and legible, but still appear quiet and ambient and classy.

What were some of the things you are going to be looking out for as it the site goes live?

I want to see how the footer harmonizes with our varying page body content and then decide if it makes sense to change the footer to match the body, or re-style the body content to sit better atop the footer.

I wonder if people on Twitter will start saying stuff @Cooperhewitt just because they know they’ll get a few minutes of fame on our homepage. That participation could be awesome or spammy. We’ll see.

I’m really excited to see the analytics. I want to see if this new layout really does boost our newsletter signup and social media participation and everything. It will be super gratifying if it does.

Of course, we’ll reiterate and revise based on all the analytics and feedback.

Mia Ridge explores the shape of Cooper-Hewitt collections

Or, “what can you learn about 270,000 records in a week?”

Guest post by Mia Ridge.

I’ve just finished a weeks’ residency at the Cooper-Hewitt, where Seb had asked me to look at ‘the shape of their collection‘.  Before I started a PhD in Digital Humanities I’d spent a lot of time poking around collections databases for various museums, but I didn’t know much about the Cooper-Hewitt’s collections so this was a nice juicy challenge.

What I hoped to do

Museum collections are often accidents of history, the result of the personalities, trends and politics that shaped an institution over its history.  I wanted to go looking for stories, to find things that piqued my curiosity and see where they lead me.  How did the collection grow over time?  What would happen if I visualised materials by date, or object type by country?  Would showing the most and least exhibited objects be interesting?  What relationships could I find between the people listed in the Artist and Makers tables, or between the collections data and the library?  Could I find a pattern in changing sizes of different types of objects over time – which objects get bigger and which get smaller over time?  Which periods have the most colourful or patterned objects?

I was planning to use records from the main collections database, which for large collections usually means some cleaning is required.  Most museum collections management systems date back several decades and there’s often a backlog of un-digitised records that need entering and older records that need enhancing to modern standards.  I thought I’d iterate through stages of cleaning the data, trying it in different visualisations, then going back to clean up more precisely as necessary.

I wanted to get the easy visualisations like timelines and maps out of the way early with tools like IBM’s ManyEyes and Google Fusion Tables so I could start to look for patterns in the who, what, where, when and why of the collections.  I hoped to find combinations of tools and data that would let a visitor go looking for potential stories in the patterns revealed, then dive into the detail to find out what lay behind it or pull back to view it in context of the whole collection.

What I encountered

Well, that was a great plan, but that’s not how it worked in reality.  Overall I spent about a day of my time dealing with the sheer size of the dataset: it’s tricky to load 60 meg worth of 270,000 rows into tools that are limited by the number of rows (Excel), rows/columns (Google Docs) or size of file (Google Refine, ManyEyes), and any search-and-replace cleaning takes a long time.

However, the unexpectedly messy data was the real issue – for whatever reason, the Cooper-Hewitt’s collections records were messier than I expected and I spent most of my time trying to get the data into a workable state.  There were also lots of missing fields, and lots of uncertainty and fuzziness but again, that’s quite common in large collections – sometimes it’s the backlog in research and enhancing records, sometimes an object is unexpectedly complex (e.g. ‘Begun in Kiryu, Japan, finished in France‘) and sometimes it’s just not possible to be certain about when or where an object was from (e.g. ‘Bali? Java? Mexico?’).  On a technical note, some of the fields contained ‘hard returns’ which cause problems when exporting data into different formats.  But the main issue was the variation and inconsistency in data entry standards over time.  For example, sometimes fields contained additional comments – this certainly livened up the Dimensions fields but also made it impossible for a computer to parse them.

In some ways, computers are dumb.  They don’t do common sense, and they get all ‘who moved my cheese’ if things aren’t as they expect them to be.  Let me show you what I mean – here are some of the different ways an object was listed as coming from the USA:

  • U.S.
  • U.S.A
  • U.S.A.
  • USA
  • United States of America
  • United States (case)

We know they all mean exactly the same place, but most computers are completely baffled by variations in punctuation and spacing, let alone acronyms versus full words.  The same inconsistencies were evident when uncertainties were expressed: it might have been interesting to look at the sets of objects that were made in ‘U.S.A. or England’ but there were so many variations like ‘U.S.A./England ?’ and ‘England & U.S.A.’ that it wasn’t feasible in the time I had.  This is what happens when tools encounter messy data when they expect something neat:

Map with mislabelled location and number of records

3 objects from ‘Denmark or Germany’? No! Messy data confuses geocoding software.

Data cleaning for fun and profit

I used Google Refine to clean up the records then upload them to Google Fusion or Google Docs for test visualisations.  Using tools that let me move data between them was the nearest I could get to a workflow that made it easy to tidy records iteratively without being able to tidy the records at source.

Refine is an amazing tool, and I would have struggled to get anywhere without it.  There are some great videos on how to use it at freeyourmetadata.org, but in short, it helps you ‘cluster‘ potentially similar values and update them so they’re all consistent.  The screenshot below shows Refine in action.

Screenshot

Google Refine in action

One issue is that museums tend to use question marks to record when a value is uncertain, but Refine strips out all punctuation, so you have to be careful about preserving the distinction between certain and uncertain records (if that’s what you want).  The suitability of general tools for cultural heritage data is a wider issue – a generic timeline generator doesn’t know what year to map ‘early 17th century’ to so it can be displayed, but date ranges are often present in museum data, and flattening it to 1600 or 1640 or even 1620 is a false level of precision that has the appearance of accuracy.

When were objects collected?

Having lost so much time to data cleaning without resolving all the issues, I eventually threw nuance, detail and accuracy out the window so I could concentrate on the overall shape of the collection. Working from the assumption that object accession numbers reflected the year of accession and probably the year of acquisition, I processed the data to extract just the year, then plotted it as accessions by department and total accessions by year. I don’t know the history of the Cooper Hewitt well enough to understand why certain years have huge peaks, but I can get a sense of the possible stories hidden behind the graph – changes of staff, the effect of World War II?  Why were 1938 and 1969 such important years for the Textiles Department, or 1991 for the Product Design and Decorative Arts Department?

Screenshot

Accessions by Year for all Departments

Or try the interactive version available at ManyEyes.

I also tried visualising the Textiles data as a bubble chart to show the years when lots of objects were collected in a different way:

Screenshot

Accessions for Textiles Department by year

Where are objects from?

I also made a map which shows which countries have been collected from most intensively.  To get this display, I had to remove out any rows that had values that didn’t exactly match the name of just one country, etc, so it doesn’t represent the entire collection. But you can get a sense of the shape of the collection – for example, there’s a strong focus on the US and Western Europe objects.

Screenshot of intensity map

Object sources by country

The interactive version is available at https://bit.ly/Ls572u.

This also demonstrates the impact of the different tools – I’m sure the Cooper-Hewitt has more than 43 objects from the countries (England, Scotland, Wales and Northern Ireland) that make up the United Kingdom but Google’s map has only picked up references to ‘United Kingdom’, effectively masking the geo-political complexities of the region and hiding tens of thousands of records.

Linking Makers to the rest of the web

Using Refine’s Reconciliation tool, I automatically ‘reconciled’ or matched 9000 names in the Makers table to records in Freebase. For example, the Cooper-Hewitt records about Gianni Versace were linked to the Freebase page about him, providing further context for objects related to him.  By linking them to a URL that identifies the subject of a record, those records can now be part of the web, not just on the web.  However, as might be expected with a table that contains a mixture of famous, notable and ordinary people, Refine couldn’t match everything with a high level of certainty so 66453 records are left as an exercise for the reader.

I also had a quick go at graphing the different roles that occurred in the Makers table.

The benefit of hindsight, and thoughts for the future

With hindsight, I would have stuck with a proper database for data manipulation because trying to clean really large datasets with consumer tools is cumbersome. I also would have been less precious about protecting the detail and nuance of the data and been more pragmatic and ruthless about splitting up files into manageable sizes and tidying up inconsistencies and uncertainties from the start.  I possibly should have given up on the big dataset and concentrated on seeing what could be done with the more complete, higher quality records.

The quality of collections data has a profound impact of the value of visualisations and mashups. The collections records would be more usable in future visualisations if they were tidied in the source database.  A tool like Google Refine can help create a list of values to be applied and provide some quick wins for cleaning date and places fields.  Uncertainty in large datasets is often unavoidable, but with some tweaking Refine could also be used to provide suggestions for representing uncertainty more consistently.  I’m biased as crowdsourcing is the subject of my PhD, but asking people who use the collections to suggest corrections to records or help work through the records that can’t be cleaned automatically could help deal with the backlog.  Crowdsourcing could also be used to help match more names from the various People fields to pages on sites like Freebase and Wikipedia.

If this has whetted your appetite and you want to have a play with some of Cooper-Hewitt’s data, check out Collection Data Access & Download.

Finally, a big thank you to the staff of the Cooper-Hewitt for hosting me for a week.

Learning from data. Part 372

Here’s an interesting image which shows a heat map of the mouse clicks in the last week on a page element on the Graphic Design: Now In Production page.

We are using a tool called Reinvigorate to generate these. And the data to help us figure out whether certain UI elements are working or not – before we do a wholesale redesign and rebuild.

Surprisingly we’re seeing a lot of interaction with the image gallery slideshow – far more than what we are seeing on a much more prominent video element on the same page.

What can we learn from this?
What should we change as a result of this data?

If anything, we are rolling out more analytics tools across our digital projects to help us better understand the behaviour of visitors.

And as we redesign our physical museum spaces we are looking at a number of different tools to help us do this in ‘meatspace‘ as well.

Might our future galleries as be as reconfigurable as our digital projects? Could we begin to treat our galleries as having this down specific UI elements?

Building Design Week NYC with Ushahidi

Today we pushed an event aggregator site for Design Week NYC out into the world.

Pulled together quickly in response to community need, we used the open source Ushahidi platform, usually used for emergency situations. We jokingly talked about using it to ‘tackle a design emergency’.

Micah answered a couple of questions about the project.

Why Ushahidi? What was Cooper-Hewitt’s relationship with them, if any?

When our communications and marketing team approached us with this project, I immediately thought of Ushahidi. We had recently featured Ushahidi in our Design with the Other 90%: CITIES exhibition, and through this I had grown to know their platform. Although originally designed for use with emergency situations and election monitoring ( or Wall Street occupying ) I thought that it could easily be customized to make sense for a city-wide week of related events. it seemed a perfect fit.

Ushahidi is an open source platform that is very much in development. Were there any tensions between using it ‘out of the box’ and the desired functionality?

Yes, we had to customize it to suit our needs. The main issue was the nomenclature Ushahidi has baked in across the platform. For example, the term “reports” didn’t really fit the vision we had for our deployment, as we would be mainly listing “events.” However, it turned out that this was fairly easy to remedy as the dev team at Ushahidi has done a decent job in compartmentalizing these kinds of things in the source code. The platform is also theme based, much like WordPress, so we were able to customize the overall look and feel of the site to our liking.

Some other issues we have come across have to do with the basic workflow. In a typical Ushahidi deployment, people on the ground submit reports. Its pretty straight forward. For our site, it would make more sense to create a list of events on a running basis and then allow the use of SMS and email and twitter to essentially comment and “check in.” It’s really only a matter of associating these things with the right data model, but this is failry rigid at the moment within the Ushahidi platform.

What were some of the major technical difficulties in getting it up and running?

Ushahidi has a lot of moving parts. Getting a basic install up and running is pretty easy ( about as easy as installing WordPress ) but it took some time to figure out how to integrate the site with the wide variety of plugins and add ons that are required to make the site really work. Functionality like following a twitter hashtag, submitting events via email or text took a little effort to get working properly.

Can you imagine a less-emergency-oriented fork of Ushahidi for these sorts of event planner operations?

Yes! I think it would be great to either fork Ushahidi for sites like ours that are more event driven and less “reporting.” However, I also sort of wonder if the dev team at Ushahidi might consider redesigning the core to make some of this a little more flexible. I’d also love to see them help prepare open sourced iPhone code for a more custom app deployment. There was a great article about using Ushahidi to essentially “roll your own” foursquare. The platform supports the idea of checkins via the iPhone app, though this part of the project seems to be fairly beta at the moment.

Totally cached out

We do a good deal of cacheing on our web properties here at Cooper-Hewitt.

Our web host, PHPFog adds a layer of cacheing for free known as Varnish cache. Varnish Cache sits in front of our web servers and performs what is known as reverse proxy cacheing. This type of cacheing is incredibly important as it adds the ability to quickly serve cached files to users on the Internet vs. continually recreating dynamic web-pages by making calls into the database.

For static assets such as images, javascripts, and css files, we turn to Amazon’s CloudFront CDN. This type of technology ( which I’ve mentioned in a number of other posts here ) places these static assets on a distributed network of “edge” locations around the world, allowing quicker access to these assets geographically speaking, and as well, it removes a good deal of burden from our application servers.

However, to go a bit further, we thought of utilizing memcache. Memcache is an in-memory database key-value type cacheing application. It helps to speed up calls to the database by storing as much of that information in memory as possible. This has been proven to be extremely effective across many gigantic, database intensive websites like Facebook, Twitter, Tumblr, and Pinterest ( to name just a few ). Check this interesting post on scaling memcached at Facebook.

To get started with memcache I turned to Amazon’s Elasticache offering. Elasticache is essentially a managed memcache server. It allows you to spin up a memcache cluster in a minute or two, and is super easy to use. In fact, you could easily provision a terabyte of memcache in the same amount of time. There is no installation, configuration or maintenance to worry about. Once your memcache cluster is up and running you can easily add or remove nodes, scaling as your needs change on a nearly real-time basis.

Check this video for a more in-depth explanation.

Elasticache also works very nicely with our servers at PHPFog as they are all built on Amazon EC2, and are in fact in the same data center. To get the whole thing working with our www.cooperhewitt.org blog, I had to do the following.

  1. Create a security group. In order for PHPFog to talk to your own Elasticache cluster, you have to create a security group that contains PHPFog’s AWS ID. There is documentation on the PHPFog website on how to do this for use with an Amazon RDS server, and the same steps apply for Elasticache.
  2. Provision an Elasticache cluster. I chose to start with a single node, m1.large instance which gives me about 7.5 Gig of RAM to work with at $0.36 an hour per node. I can always add more nodes in the future if I want, and I can even roll down to a smaller instance size by simply creating another cluster.
  3. Let things simmer for a minute. It takes a minute or two for your cluster to initialize.
  4. On WordPress install the W3TC plugin. This plugin allows you to connect up your Elasticache server, and as well offers tons of configurable options for use with things like a CloudFront CDN and more. Its a must have! If you are on Drupal or some other CMS. there are similar modules that achieve the same result.
  5. In W3TC enable whatever types of cacheing you wish to do and set the cache type to memcache. In my case, I chose page cache, minify cache, database cache, and object cache, all of which work with memcache. Additionally I set up our CloudFront CDN from within this same plugin.
  6. In each cache types config page, set your memcache endpoint to the one given by your AWS control panel. If you have multiple nodes, you will have to copy and paste them all into each of these spaces. There is a test button you can hit to make sure your installation is communicating with your memcache server.

That last bit is interesting. You can have multiple clusters with multiple nodes serving as cache servers for a number of different purposes. You can also use the same cache cluster for multiple sites, so long as they are all reachable via your security group settings.

Once everything is configured and working you can log out and let the cacheing being. It helps to click through the site to allow the cache to build up, but this will happen automatically if your site gets a decent amount of traffic. In the AWS control panel you can check on your cache cluster in the CloudWatch tab where you can keep track of how much memory and cpu is being utilized at any given time. You can also set up alerts so that if you run out of cache, you get notified so you can easily add some nodes.

We hope to employ this same cacheing cluster on our main cooperhewitt.org website, as well as a number of our other web properties in the near future.