Tag Archives: residents

Guest post: Notes from hacking on the Cooper-Hewitt collections API

A couple of days ago the Labs hosted a guest to play with our API.

Over to Frankie to explain what he did and the challenges he faced. As it turns out, there’s a lot you can get done in a day.

Hi, I’m Frankie Roberto. I used to work at the Science Museum in London, where I produced their web projects. I’ve also worked with museums such as the British Museum whilst at digital agency Rattle. One theme running through all of this time is the importance of data, and the things that it can enable.

So when I learnt that the Cooper-Hewitt Museum had released a ‘public alpha’ of their collections database, the idea of spending a day playing with the data whilst in New York (on holiday!) seemed like it’d be fun. Plus, I get to hang out with Seb & co.

I signed up for a an API account ahead of time. This does feel like a bit of hurdle. Because the API uses oAuth 2.0, as well as creating an account, you then have to create an application, and then authorise yourself against your own application in order to get an access token which ultimately grants you access to the data. This makes more sense for situations where you want to get access to another user’s data (e.g. let’s say that users can bookmark favourite objects and you want to display a visualisation of them). For accessing public data it’s a little overkill. Thankfully the web interface makes it all fairly straightforward.

Ideally, I think it’d be simpler and more developer-friendly not to require API keys at all, and instead to simply allow anyone to retrieve the data with a simple GET request. These can even be tried out in a browser – a common convention is to simply add ‘.json’ on the end of URLs for JSON views. This also lets you use HTTP-level caching, which works at the browser end, the server end and proxies in the middle, keeping things speedy. On the downside, this would make it harder to monitor API usage.

Authentication quibbles aside, once set up I could begin querying the data.

I came to the Cooper-Hewitt knowing very little about the institution other than that it is a design museum. My expectations then were that the collection would be a treasure trove of great design from the past century – things like the Henry vacuum cleaner or the Juicy Salif lemon squeezer by Philippe Starck. In short: ‘design classics‘.

‘Classic’ is a funny word, after abused as a euphemism for old and obsolete, but when applied to design I think it implies quality, innovation, and timelessness – things you might still use today (hence the community around maintaining ‘classic cars’).

My challenge then was to see if, for a given type of thing, I could show the ‘classic’ versions of that thing from the Cooper-Hewitt collection.

To kick off, I looked at the list of ‘types’ in the collection. There are 2,998 of these, and they are for the most part simple & recognisable words or short phrases – things like ‘teapot’ and ‘chair’. The data is a little messy, also including more specific things like ‘side chair’ and ‘teapot and lid’, but, y’know, it’s good enough for now.

I could have retrieved the entire list of types through the API, but as you only get a small bunch at a time, this would have required ‘paging’ through the results with multiple requests. Not too tricky, but rather than coding the logic for this, it was a lot simpler to just import the full list from the CSV dump on GitHub.

The next step was to retrieve a list of objects for each type.

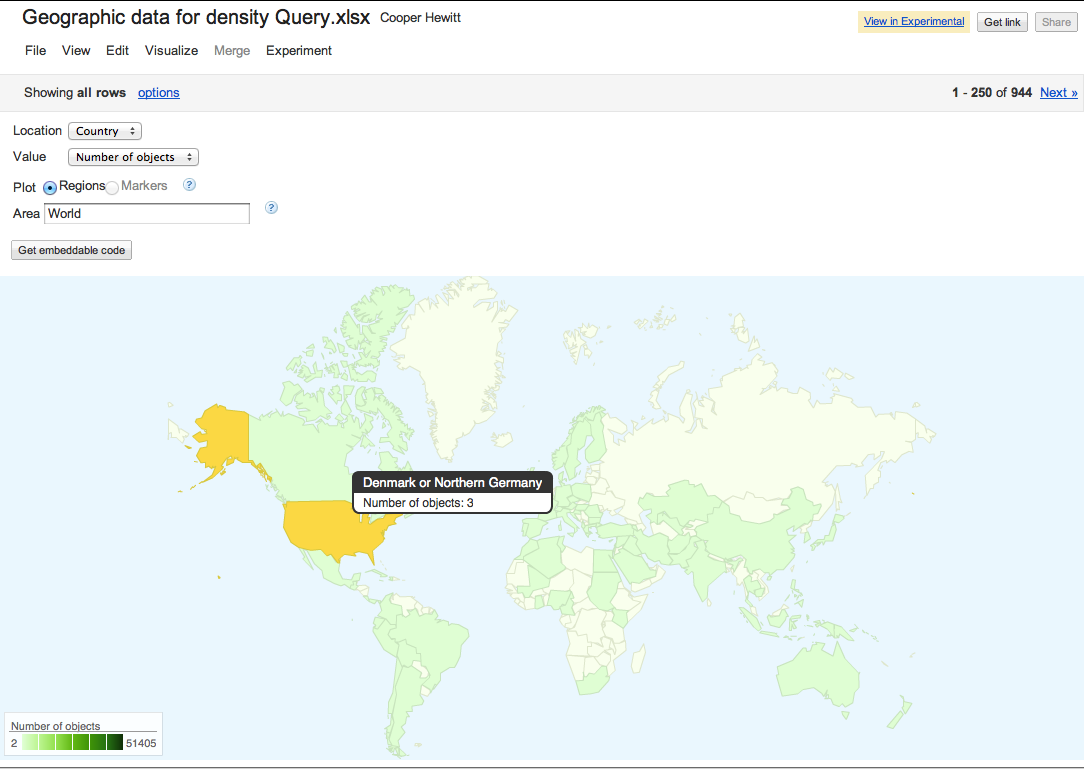
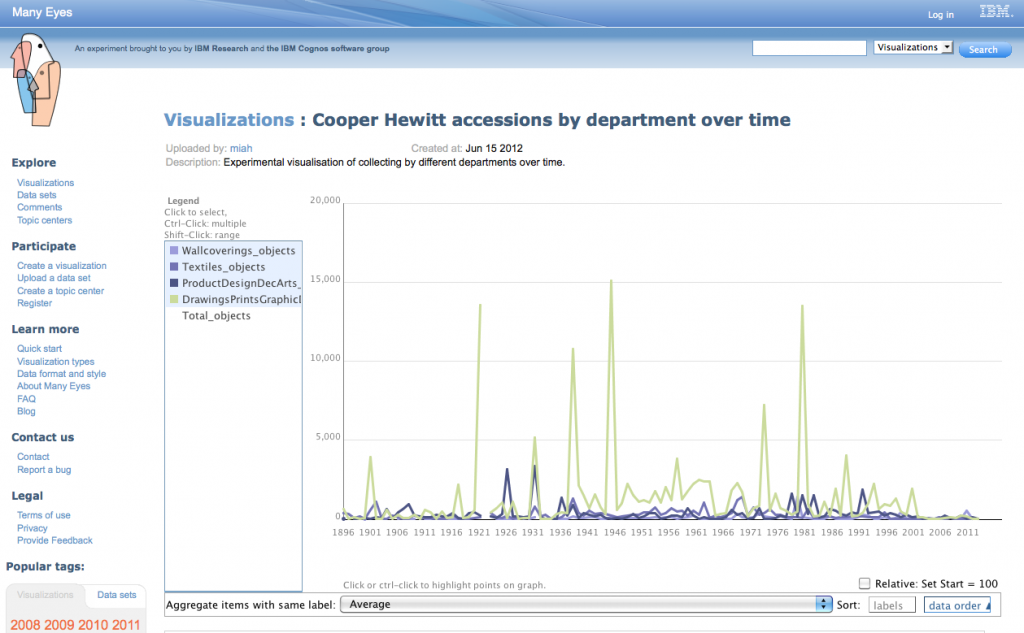
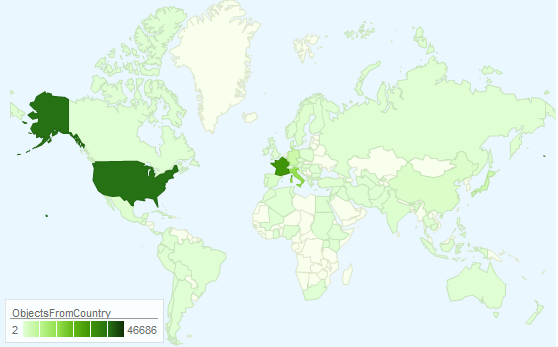
Unfortunately, this didn’t actually seem to be possible using the API (yet). So I went back to GitHub and used the CSV dump of all objects. This contains around a 100,000 objects. Not a huge amount, but with a tip-off from Seb, I realised that I was actually only interested in the objects from the ‘product design’ department – a much smaller list of just 19,848 objects (the rest seem to be mainly drawings and textiles).

With these objects imported, the next step was to match the objects with the types.

This data didn’t seem to be in the CSV file – and it isn’t returned in the API response for object details either (an accidental omission, I think). Stuck, I turned to Seb’s team, and soon learned that what I thought was the object ‘name’ was actually a concatenation of the object’s type and age, separated by a comma. So, I could get an object’s type by simply reversing the process (slight gotcha: remember to ignore case).

At this point I had a database of objects by type, but no images – which for most purposes are pretty crucial.

Ideally, links to the images would’ve been in the CSV dump. Instead, I’d have to query the API for each object and collect the links. Objects can have multiple images, but I only really need the main one, which is designated the ‘primary’ image in the API. Oddly, a good proportion of the objects had no primary image, but did have one or more non-primary images. In these cases, I’d just select the first image.

Script written, I started hitting the API. With 19,848 requests to make, I figured this’d take some time. About a quarter of the way through, I realised that the same data was also available in GitHub, and this could be queried by requesting the ‘raw’ version of the URLs (constructed by splitting the object id into bunches of three digits). So I modified my script to do just that, and set it going, this time starting from the bottom of my list of objects and working up. The GitHub-querying script ran a little faster than the Cooper-Hewitt API (probably not too surprising), and so both scripts ‘met’ somewhere in the middle of the list.

The results of this were that I had images for roughly a quarter of the product design objects, with around 5,000. This seems like quite a lot, but given that lots of these are rather obscure things like ‘matchsafes’, the collection actually isn’t that big, and is rather patchy.

There’s a limit to how many products you can actually collect (and store), of course, and so I’m not suggesting that the museum go on an acquiring spree. But I do wonder whether, to present a good experience online, it might be wise to try and merge in some external product design databases to fill in the holes.

By the time I’d assembled all the data, I didn’t have too much time to consider how to present the ‘classic’ products from among the collection.

Ideally, I think this is something that the museum should expose its expertise in. It can be tempting for museums to pretend that all objects have equal value, but in reality there are always some objects that are considered better, more unique, or in this case ‘more classic’ than others. Museum curators are ideally placed to make these judgement calls (and to explain them). For mass-manufactured design objects, this is arguably more important than collecting them in the first place (it’s unlikely you’d not be able to find an original iPod for an exhibition if you needed one).

Ideas we came up with amongst the team were to try and look up the price of the object on eBay (price isn’t a perfect indicator of design value, but might be a reasonable proxy), or to try and see whether other museums, like the V&A, had also collected the same object.

In the end, I went with a simple crowd-sourcing model. Initially three random objects from each type are picked to be shown as the ‘classic’ ones (3 feels like a good number), with the others shown as smaller thumbnails below. You can then very simply vote objects up or down.

The result of this very simple demo is online at https://designclassics.herokuapp.com – feel free to explore (and vote on the objects).

Thanks to the Cooper-Hewitt for hosting me for the day. I look forward to seeing how the ‘alpha’ collections database develops into the ‘beta’, and then the full launch.

If you are an interaction design or digital humanities student, or just a nerd with a bent for playing with museum collections, and you feel like hanging out for a day or two in the Labs to make things then we’d love to have you over.

Drop us a line and we’ll make it happen.

Mia Ridge explores the shape of Cooper-Hewitt collections

Or, “what can you learn about 270,000 records in a week?”

Guest post by Mia Ridge.

I’ve just finished a weeks’ residency at the Cooper-Hewitt, where Seb had asked me to look at ‘the shape of their collection‘.  Before I started a PhD in Digital Humanities I’d spent a lot of time poking around collections databases for various museums, but I didn’t know much about the Cooper-Hewitt’s collections so this was a nice juicy challenge.

What I hoped to do

Museum collections are often accidents of history, the result of the personalities, trends and politics that shaped an institution over its history.  I wanted to go looking for stories, to find things that piqued my curiosity and see where they lead me.  How did the collection grow over time?  What would happen if I visualised materials by date, or object type by country?  Would showing the most and least exhibited objects be interesting?  What relationships could I find between the people listed in the Artist and Makers tables, or between the collections data and the library?  Could I find a pattern in changing sizes of different types of objects over time – which objects get bigger and which get smaller over time?  Which periods have the most colourful or patterned objects?

I was planning to use records from the main collections database, which for large collections usually means some cleaning is required.  Most museum collections management systems date back several decades and there’s often a backlog of un-digitised records that need entering and older records that need enhancing to modern standards.  I thought I’d iterate through stages of cleaning the data, trying it in different visualisations, then going back to clean up more precisely as necessary.

I wanted to get the easy visualisations like timelines and maps out of the way early with tools like IBM’s ManyEyes and Google Fusion Tables so I could start to look for patterns in the who, what, where, when and why of the collections.  I hoped to find combinations of tools and data that would let a visitor go looking for potential stories in the patterns revealed, then dive into the detail to find out what lay behind it or pull back to view it in context of the whole collection.

What I encountered

Well, that was a great plan, but that’s not how it worked in reality.  Overall I spent about a day of my time dealing with the sheer size of the dataset: it’s tricky to load 60 meg worth of 270,000 rows into tools that are limited by the number of rows (Excel), rows/columns (Google Docs) or size of file (Google Refine, ManyEyes), and any search-and-replace cleaning takes a long time.

However, the unexpectedly messy data was the real issue – for whatever reason, the Cooper-Hewitt’s collections records were messier than I expected and I spent most of my time trying to get the data into a workable state.  There were also lots of missing fields, and lots of uncertainty and fuzziness but again, that’s quite common in large collections – sometimes it’s the backlog in research and enhancing records, sometimes an object is unexpectedly complex (e.g. ‘Begun in Kiryu, Japan, finished in France‘) and sometimes it’s just not possible to be certain about when or where an object was from (e.g. ‘Bali? Java? Mexico?’).  On a technical note, some of the fields contained ‘hard returns’ which cause problems when exporting data into different formats.  But the main issue was the variation and inconsistency in data entry standards over time.  For example, sometimes fields contained additional comments – this certainly livened up the Dimensions fields but also made it impossible for a computer to parse them.

In some ways, computers are dumb.  They don’t do common sense, and they get all ‘who moved my cheese’ if things aren’t as they expect them to be.  Let me show you what I mean – here are some of the different ways an object was listed as coming from the USA:

  • U.S.
  • U.S.A
  • U.S.A.
  • USA
  • United States of America
  • United States (case)

We know they all mean exactly the same place, but most computers are completely baffled by variations in punctuation and spacing, let alone acronyms versus full words.  The same inconsistencies were evident when uncertainties were expressed: it might have been interesting to look at the sets of objects that were made in ‘U.S.A. or England’ but there were so many variations like ‘U.S.A./England ?’ and ‘England & U.S.A.’ that it wasn’t feasible in the time I had.  This is what happens when tools encounter messy data when they expect something neat:

Map with mislabelled location and number of records

3 objects from ‘Denmark or Germany’? No! Messy data confuses geocoding software.

Data cleaning for fun and profit

I used Google Refine to clean up the records then upload them to Google Fusion or Google Docs for test visualisations.  Using tools that let me move data between them was the nearest I could get to a workflow that made it easy to tidy records iteratively without being able to tidy the records at source.

Refine is an amazing tool, and I would have struggled to get anywhere without it.  There are some great videos on how to use it at freeyourmetadata.org, but in short, it helps you ‘cluster‘ potentially similar values and update them so they’re all consistent.  The screenshot below shows Refine in action.

Screenshot

Google Refine in action

One issue is that museums tend to use question marks to record when a value is uncertain, but Refine strips out all punctuation, so you have to be careful about preserving the distinction between certain and uncertain records (if that’s what you want).  The suitability of general tools for cultural heritage data is a wider issue – a generic timeline generator doesn’t know what year to map ‘early 17th century’ to so it can be displayed, but date ranges are often present in museum data, and flattening it to 1600 or 1640 or even 1620 is a false level of precision that has the appearance of accuracy.

When were objects collected?

Having lost so much time to data cleaning without resolving all the issues, I eventually threw nuance, detail and accuracy out the window so I could concentrate on the overall shape of the collection. Working from the assumption that object accession numbers reflected the year of accession and probably the year of acquisition, I processed the data to extract just the year, then plotted it as accessions by department and total accessions by year. I don’t know the history of the Cooper Hewitt well enough to understand why certain years have huge peaks, but I can get a sense of the possible stories hidden behind the graph – changes of staff, the effect of World War II?  Why were 1938 and 1969 such important years for the Textiles Department, or 1991 for the Product Design and Decorative Arts Department?

Screenshot

Accessions by Year for all Departments

Or try the interactive version available at ManyEyes.

I also tried visualising the Textiles data as a bubble chart to show the years when lots of objects were collected in a different way:

Screenshot

Accessions for Textiles Department by year

Where are objects from?

I also made a map which shows which countries have been collected from most intensively.  To get this display, I had to remove out any rows that had values that didn’t exactly match the name of just one country, etc, so it doesn’t represent the entire collection. But you can get a sense of the shape of the collection – for example, there’s a strong focus on the US and Western Europe objects.

Screenshot of intensity map

Object sources by country

The interactive version is available at https://bit.ly/Ls572u.

This also demonstrates the impact of the different tools – I’m sure the Cooper-Hewitt has more than 43 objects from the countries (England, Scotland, Wales and Northern Ireland) that make up the United Kingdom but Google’s map has only picked up references to ‘United Kingdom’, effectively masking the geo-political complexities of the region and hiding tens of thousands of records.

Linking Makers to the rest of the web

Using Refine’s Reconciliation tool, I automatically ‘reconciled’ or matched 9000 names in the Makers table to records in Freebase. For example, the Cooper-Hewitt records about Gianni Versace were linked to the Freebase page about him, providing further context for objects related to him.  By linking them to a URL that identifies the subject of a record, those records can now be part of the web, not just on the web.  However, as might be expected with a table that contains a mixture of famous, notable and ordinary people, Refine couldn’t match everything with a high level of certainty so 66453 records are left as an exercise for the reader.

I also had a quick go at graphing the different roles that occurred in the Makers table.

The benefit of hindsight, and thoughts for the future

With hindsight, I would have stuck with a proper database for data manipulation because trying to clean really large datasets with consumer tools is cumbersome. I also would have been less precious about protecting the detail and nuance of the data and been more pragmatic and ruthless about splitting up files into manageable sizes and tidying up inconsistencies and uncertainties from the start.  I possibly should have given up on the big dataset and concentrated on seeing what could be done with the more complete, higher quality records.

The quality of collections data has a profound impact of the value of visualisations and mashups. The collections records would be more usable in future visualisations if they were tidied in the source database.  A tool like Google Refine can help create a list of values to be applied and provide some quick wins for cleaning date and places fields.  Uncertainty in large datasets is often unavoidable, but with some tweaking Refine could also be used to provide suggestions for representing uncertainty more consistently.  I’m biased as crowdsourcing is the subject of my PhD, but asking people who use the collections to suggest corrections to records or help work through the records that can’t be cleaned automatically could help deal with the backlog.  Crowdsourcing could also be used to help match more names from the various People fields to pages on sites like Freebase and Wikipedia.

If this has whetted your appetite and you want to have a play with some of Cooper-Hewitt’s data, check out Collection Data Access & Download.

Finally, a big thank you to the staff of the Cooper-Hewitt for hosting me for a week.