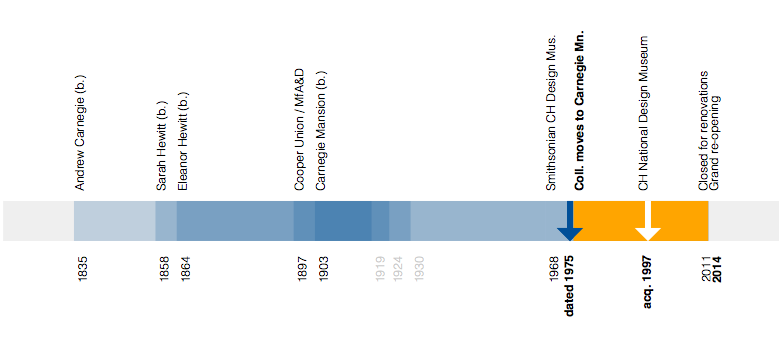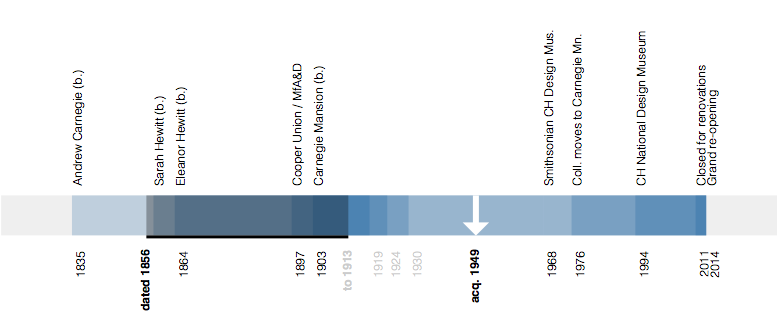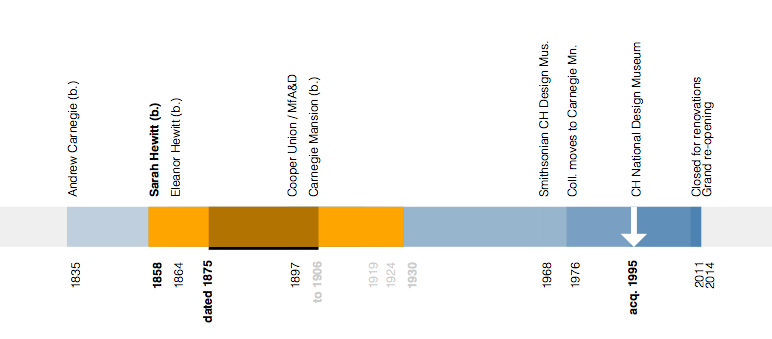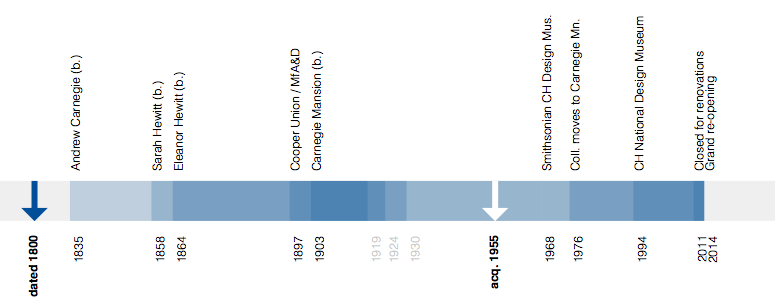
We’ve added a new experimental feature to the collections website. It’s an interactive visualization depicting when an object was produced and when that object was collected using some of the major milestones and individuals involved in the Cooper-Hewitt’s history itself as a bracketing device.
Specifically the years 1835 when Andrew Carnegie was born and 2014 when the museum will re-open after a major renovation to Carnegie’s New York City mansion where the collection is now housed. It’s not that Andrew Carnegie’s birth signals the beginning of time but rather it is the first of a series of events that shape the Cooper-Hewitt as we know it today.

The timeline’s goal is to visualize an individual object’s history relative to the velocity of major events that define the larger collection.
Many of those events overlap. The lives of Andrew Carnegie and the Hewitt Sisters all overlapped one another and they were all alive during the construction of Carnegie’s mansion and the creation of Hewitt Sister’s Cooper Union Museum for the Arts of Decoration. The life of the mansion overlaps the Cooper-Hewitt becoming part of the Smithsonian in 1976 and assuming the mantle of the National Design Museum in the mid-1990s.
Wherever possible we show both the start and end dates for an object represented as its own underlined event span. If we only know the start date for an object we indicate that using a blue arrow. The date that the object was acquired by the museum is indicated using a white arrow.

The soundtrack of histories that surround an object are depicted as a series of sequential and semi-transparent blocks layered one atop the other to try and reflect a density of proximate events. If you mouse over the label for an event it is highlighted, in orange, in the overall timeline.
We had three motivations in creating the timeline:
- To continue to develop a visual language to represent the richness and the complexity of our collection. To create views that allows a person to understand the outline of a history and invite further investigation.
- To start understanding the ways in which we need to expose the collection metadata so that it can play nicely with data visualization tools.
- To get our feet wet with the D3 Javascript library which is currently the (friendly) 800-pound gorilla in the data visualization space. D3 is incredibly powerful but also a bit of a head-scratch to get started with so this is us, getting started.
This is only the first of many more visualizations to come and we are hoping to develop a series of building blocks and methodologies to allow to build more and more experimental features as quickly as we can think of them.
So head over to the experimental section of the collections website and enable the feature flag for the Object Timeline and have a play and let us know what you think!

We’ve also made the Github repository for the underlying Javascript library that powers the timeline public and released the code under a BSD license. It should be generic enough to work for any dataset that follows a similar pattern to ours and is not specific to a museum collection.
If you look under the hood you might be horrified at what you see. We made a very conscious decision, at this stage of things while we get to know D3, to focus more on the functionality of the timeline itself rather than the elegance of the code. This is a very early experiment and we would be grateful for bug fixes and suggestions for how to make it better.

Pingback: A Kiwi spends three weeks in the Cooper-Hewitt Labs | Cooper Hewitt Labs
Pingback: Speak to the Eyes: The History and Practice of Information Visualization | Jefferson Bailey
Pingback: The Emoji Timeline | Cooper Hewitt Labs
Pingback: The Emoji Timeline | Sam Brenner: Notes