Monthly Archives: February 2013

"All your color are belong to Giv"

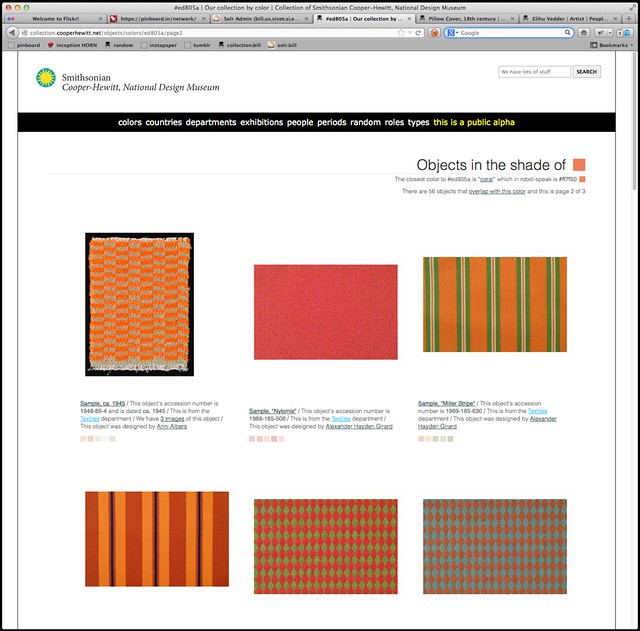
Today we enabled the ability to browse the collections website by color. Yay!

Don’t worry — you can also browse by colour but since the Cooper-Hewitt is part of the Smithsonian I will continue to use US Imperial Fahrenheit spelling for the rest of this blog post.

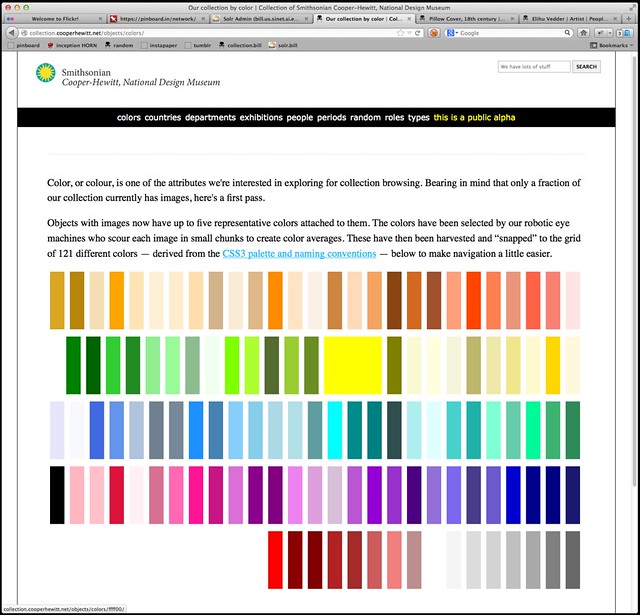
Objects with images now have up to five representative colors attached to them. The colors have been selected by our robotic eye machines who scour each image in small chunks to create color averages. We use a two-pass process to do this:

  • First, we run every image through Giv Parvaneh’s handy color analysis tool RoyGBiv. Giv’s tool calculates both the average color of an image and a palette of up to five predominant colors. This is all based on the work Giv did for version two of the Powerhouse Museum’s Electronic Swatchbook, back in 2009.

  • Then, for each color in the palette list (we aren’t interested in the average) we calculate the nearest color in the CSS3 color spectrum. We “snap” each color to the CSS3 grid, so to speak.

We store all the values but only index the CSS3 colors. When someone searches the collection for a given color we do the same trick and snap their query back down to a managable set of 121 colors rather than trying to search for things across the millions of shades and variations of colors that modern life affords us.

Our databases aren’t set up for doing complicated color math across the entire collection so this is a nice way to reduce the scope of the problem, especially since this is just a “first draft”. It’s been interesting to see how well the CSS3 palette maps to the array of colors in the collection. There are some dubious matches but overall it has served us very well by sorting things in to accurate-enough buckets that ensure a reasonable spread of objects for each query.

We also display the palette for the object’s primary image on the object page (for those things that have been digitized).
We’re not being very clever about how we sort the objects or how we let you choose to sort the objects (you can’t) which is mostly a function of knowing that the database layer for all of this will change soon and not getting stuck working on fiddly bits we know that we’re going to replace anyway.

There are lots of different palettes out there and as we start to make better sense of the boring technical stuff we plan to expose more of them on the site itself. In the process of doing all this work we’ve also released a couple more pieces of software on Github:

  • color-utils is a mostly a grab bag of tools and tests and different palettes that I wrote for myself as we were building this. The palettes are plain vanilla JSON files and at the moment there are lists for the CSS3 colors, Wikipedia’s list of Crayola crayon colors, the various shades of SOME-COLOR pages on Wikipedia, both as a single list and bucketed by family (red, green, etc.) and the Scandawegian Natural Colour System mostly just because Frankie Roberto told me about it this morning.

  • palette-server is a very small WSGI-compliant HTTP pony (or “httpony“) that wraps Giv’s color analyzer and the snap-to-grid code in a simple web interface. We run this locally on the machine with all the images and the site code simply passes along the path to an image as a GET parameter. Like this:

    curl  'https://localhost:8000?path=/Users/asc/Desktop/cat.jpg' | python -m json.tool
    
    {
    "reference-closest": "css3",
    "average": {
        "closest": "#808080",
        "color": "#8e895a",
    },
    "palette": [
        {
            "closest": "#a0522d",
            "color": "#957d34",
            }
    
            ... and so on ...
        }
    }

This allows us to offload all the image processing to third-party libraries and people who are smarter about color wrangling than we are.

Both pieces of code are pretty rough around the edges so we’d welcome your thoughts and contributions. Pretty short on my TO DO list is to merge the code to snap-to-grid using a user-defined palette back in to the HTTP palette server.
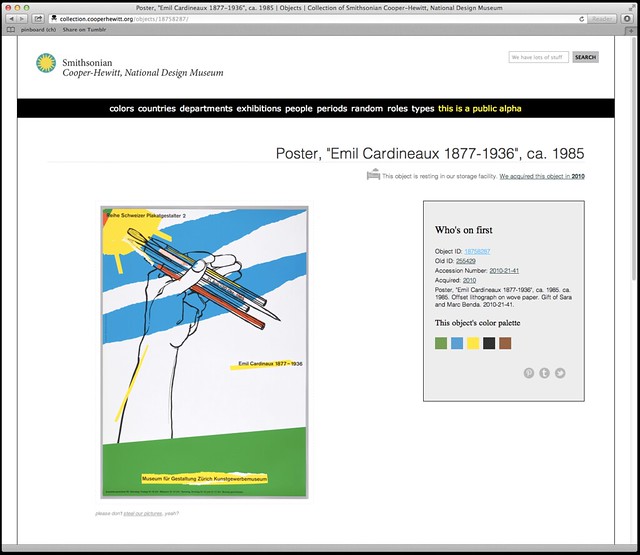
As I write this, color palettes are not exposed in either the API or the collections metadata dumps but that will happen in pretty short order. Also, a page to select objects based on a random color but I just thought of that as I was copy-paste-ing the links for those other things that I need to do first…

In the meantime, head on over to the collections website and have a poke around.

Exploring quickly made 3D models of the mansion

Restoring the Carnegie Mansion which provides the shell in which Cooper-Hewitt resides, gives a fantastic opportunity to test some 3D scanning. So in the latter part of 2012 we started exploring some of the options.

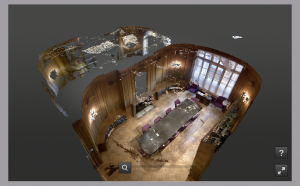
One local startup, Floored.com, came to do a test scan of our freshly restored National Design Library. In just 15 minutes their Matterport camera had scanned the room and their servers were generating a navigable 3D model. This is much more than a 360 panorama, it is a proper 3D model, and one that could, with more clean up be used for exhibition design purposes as much as general playfulness.

3d-library-floored

We’re pretty excited to see what is becoming possible with quick scanning. Whilst these models aren’t high enough resolution right now, the trade off between speed and quality is becoming less and less every year.

We’re sharing this, too, because of the way the unmasked mirror in the scan has created a ‘room that isn’t there’. It would be a good place to hide treasure if the 3D model ever ended up in a game engine.

Go have an explore.

Introducing the Albers API method

Screen Shot 2013-02-06 at 12.11.51 PM

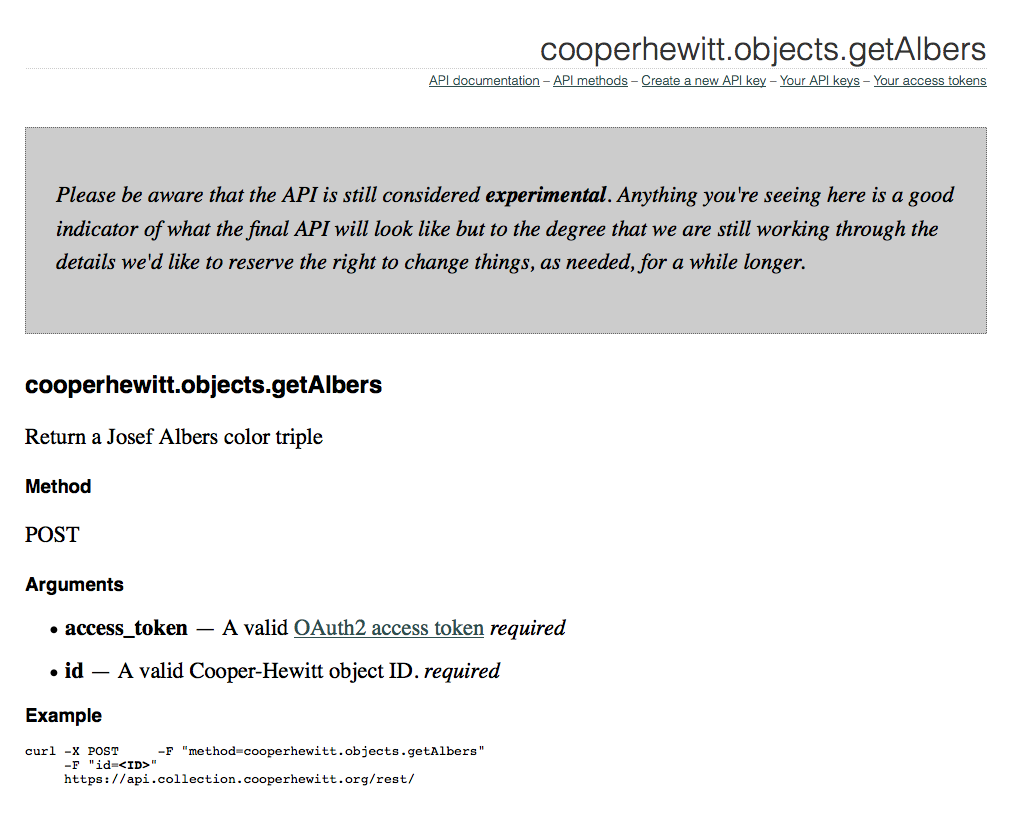
We recently added a method to our Collection API which allows you to get any object’s “Albers” color codes. This is a pretty straightforward method where you pass the API an object ID, and it returns to you a triple of color values in hex format.

As an experiment, I thought it would be fun to write a short script which uses our API to grab a random object, grab its Albers colors, and then use that info to build an Albers inspired image. So here goes.

For this project I chose to work in Python as I already have some experience with it, and I know it has a decent imaging library. I started by using pycurl to authenticate with our API storing the result in a buffer and then using simplejson to parse the results. This first step grabs a random object using the getRandom API method.

api_token = 'YOUR-COOPER-HEWITT-TOKEN'

buf = cStringIO.StringIO()

c = pycurl.Curl()
c.setopt(c.URL, 'https://api.collection.cooperhewitt.org/rest')
d = {'method':'cooperhewitt.objects.getRandom','access_token':api_token}

c.setopt(c.WRITEFUNCTION, buf.write)

c.setopt(c.POSTFIELDS, urllib.urlencode(d) )
c.perform()

random = json.loads(buf.getvalue())

buf.reset()
buf.truncate()

object_id = random.get('object', [])
object_id = object_id.get('id', [])

print object_id

I then use the object ID I got back to ask for the Albers color codes. The getAlbers API method returns the hex color value and ID number for each “ring.” This is kind of interesting because not only do I know the color value, but I know what it refers to in our collection ( period_id, type_id, and department_id ).

d = {'method':'cooperhewitt.objects.getAlbers','id':object_id ,'access_token':api_token}

c.setopt(c.POSTFIELDS, urllib.urlencode(d) )
c.perform()

albers = json.loads(buf.getvalue())

rings = albers.get('rings',[])
ring1color = rings[0]['hex_color']
ring2color = rings[1]['hex_color']
ring3color = rings[2]['hex_color']

print ring1color, ring2color, ring3color

buf.close()

Now that I have the ring colors I can build my image. To do this, I chose to follow the same pattern of concentric rings that Aaron talks about in this post, introducing the Albers images as a visual language on our collections website. However, to make things a little interesting, I chose to add some randomness to the the size and position of each ring. Building the image in python was pretty easy using the ImageDraw module

size = (1000,1000)
im = Image.new('RGB', size, ring1color)
draw = ImageDraw.Draw(im)

ring2coordinates = ( randint(50,100), randint(50,100) , randint(900, 950), randint(900,950))

print ring2coordinates

ring3coordinates = ( randint(ring2coordinates[0]+50, ring2coordinates[0]+100) , randint(ring2coordinates[1]+50, ring2coordinates[1]+100) ,  randint(ring2coordinates[2]-200, ring2coordinates[2]-50) , randint(ring2coordinates[3]-200, ring2coordinates[3]-50) )

print ring3coordinates

draw.rectangle(ring2coordinates, fill=ring2color)
draw.rectangle(ring3coordinates, fill=ring3color)

del draw

im.save('file.png', 'PNG')

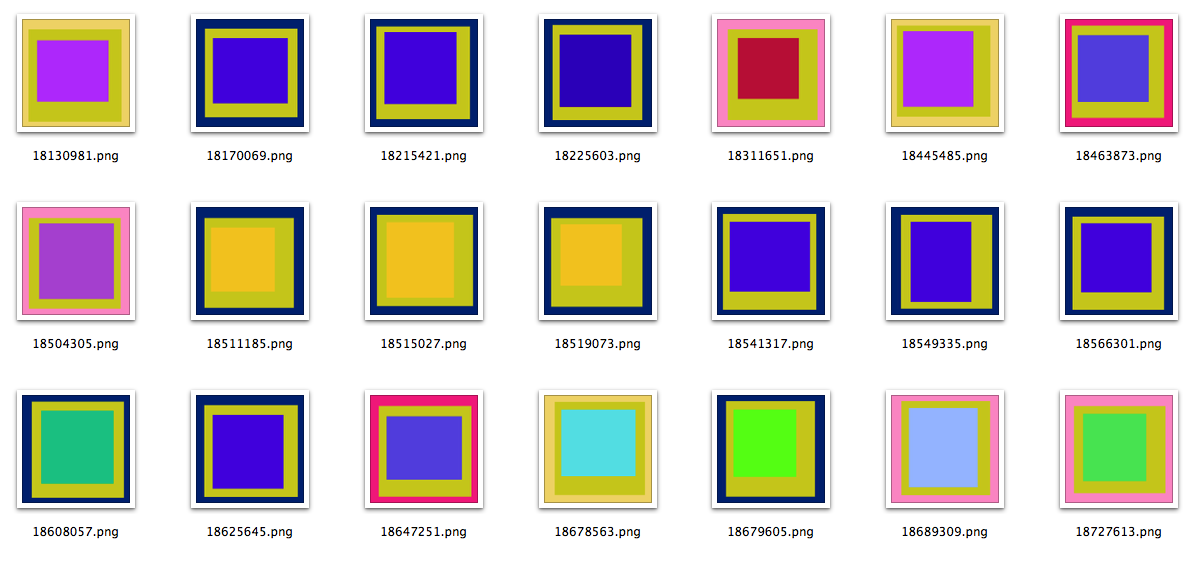
The result are images that look like the one below, saved to my local disk. If you’d like to grab a copy of the full working python script for this, please check out this Gist.

Albersify

A bunch of Albers images

So, what can you humanities hackers do with it?

Albers boxes

We have a lot of objects in our collection. Unfortunately we are also lacking images for many of those same objects. There are a variety of reasons why we might not have an image for something in our collection.

  • It may not have been digitized yet (aka had its picture taken).
  • We may not have secured the reproduction rights to publish an image for an object.
  • Sometimes, we think we have an image for an object but it’s managed to get lost in the shuffle. That’s not awesome but it does happen.

What all of those examples point to though is the need for a way to convey the reason why an image can’t be displayed. Traditionally museum websites have done this using a single stock (and frankly, boring) image-not-available placeholder.

We recently — finally — updated the site to display list style results with images, by default. Yay!

In the process of doing that we also added two different icons for images that have gone missing and images that we don’t have, either because an object hasn’t been digitized or we don’t have the reproduction rights which is kind of like not being digitized. This is what they look like:

The not digitized icon is courtesy Shelby Blair (The Noun Project).
The missing image icon is courtesy Henrik LM (The Noun Project).

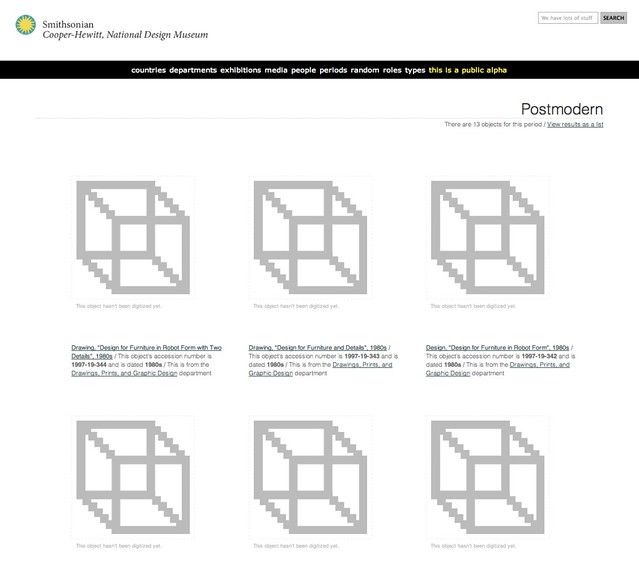
So that’s a start but it still means that we can end up with pages of results that look like this:

What to do?

We have begun thinking of the problem as one of needing to develop a visual language (languages?) that a person can become familiar with, over time, and use a way to quickly scan a result set and gain some understanding in the absence of an image of the object itself.

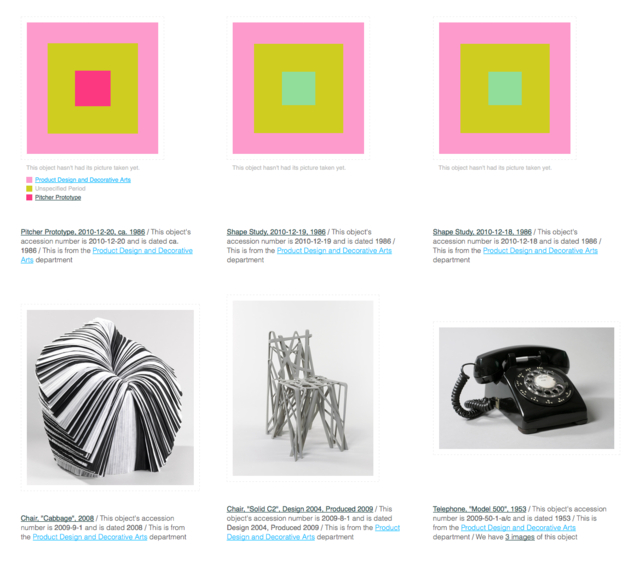
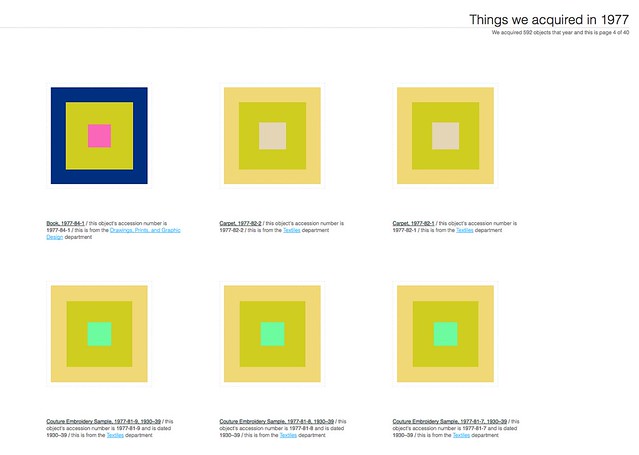
Today, we let some of those ideas loose on the website (in a controlled and experimental way). They’re called Albers boxes. Albers boxes are a shout-out and a whole lot of warm and sloppy kisses for the artist Josef Albers and his book about the Interaction of Color.

This is what they look like:

The outer ring of an Albers box represents the department that an object belongs to. The middle ring represents the period that an object is part of. The inner ring denotes the type of object. When you mouse over an Albers box we display a legend for each one of the colors.

We expect that the Albers boxes will be a bit confusing to people at first but we also think that their value will quickly become apparent. Consider the following example. The Albers boxes allow us to look at this set of objects and understand that there are two different departments, two periods and three types of objects.

Or at least that there are different sorts of things which is harder to do when the alternative is a waterfall of museum-issued blank-faced placeholder images.

The Albers boxes are not enabled by default. You’ll need to head over to the new experimental section of the collections website and tell us that you’d like to see them. Experimental features are, well, experimental so they might go away or change without much notice but we hope this is just the first of many.

Enjoy!

Also: If you’re wondering how the colors are chosen take a look at this lovely blog post from 2007 from the equally lovely kids at Dopplr. They had the right idea way back then so we’re just doing what they did!