Hi Labs blog readers! My name is Belle and I’m this summer’s Peter A. Krueger intern in the Digital and Emerging Media Department. At the end of my time here I’ll be starting my senior year at Wellesley College, where I’m majoring in Media Arts and Sciences, focusing on Human-Computer Interaction and Printmaking. My project for this summer, the “visit statistics page” augments Cooper Hewitt’s distinctive post-visit experience.
On my first day at Cooper Hewitt I learned that I had the freedom to determine my own internship-long project. This kind of freedom was daunting. Where should I even start? I scoured Cooper Hewitt’s website, GitHub issue logs, Labs blog posts, and talked to friends and museum staff. I determined that my project should focus on experience and data relating to the Pen, specifically the “post-visit experience”, since it’s so unique to Cooper Hewitt. After visiting the physical museum, a user can go to the website and find everything they collected with their Pen during their visit. Viewing their collected objects is often the first time a user is accessing the website after their visit, so a good user experience is essential to keep the user interested in what else the collections website has to offer.
I looked for areas of expansion within the post-visit experience and zeroed in on the way collected objects are shown to a user when they view their visit—a grid layout with object thumbnails, titles, and the time collected with the Pen. The interconnection of object data throughout the collections site makes it effortless and enjoyable to sort through object fields and click links to explore deep into the collection. The UI for objects and data on the post-visit pages, however, did not yet capitalize upon the opportunity to cross-link visit data and collections data. This is what the post-visit experience was lacking. I wanted to add a dimension of exploration to a user’s visit and gently launch them into the depths of the collections website. A key goal for my project was for it to be visually based but still accessible to the blind. A completely graphics-based page would be inaccessible to those using screen readers to browse their collection. At the end of all of my brainstorming, I developed the solution to accomplish my goal of accessibility: a primarily text based statistics page, which had the potential to add non-essential visualizations.
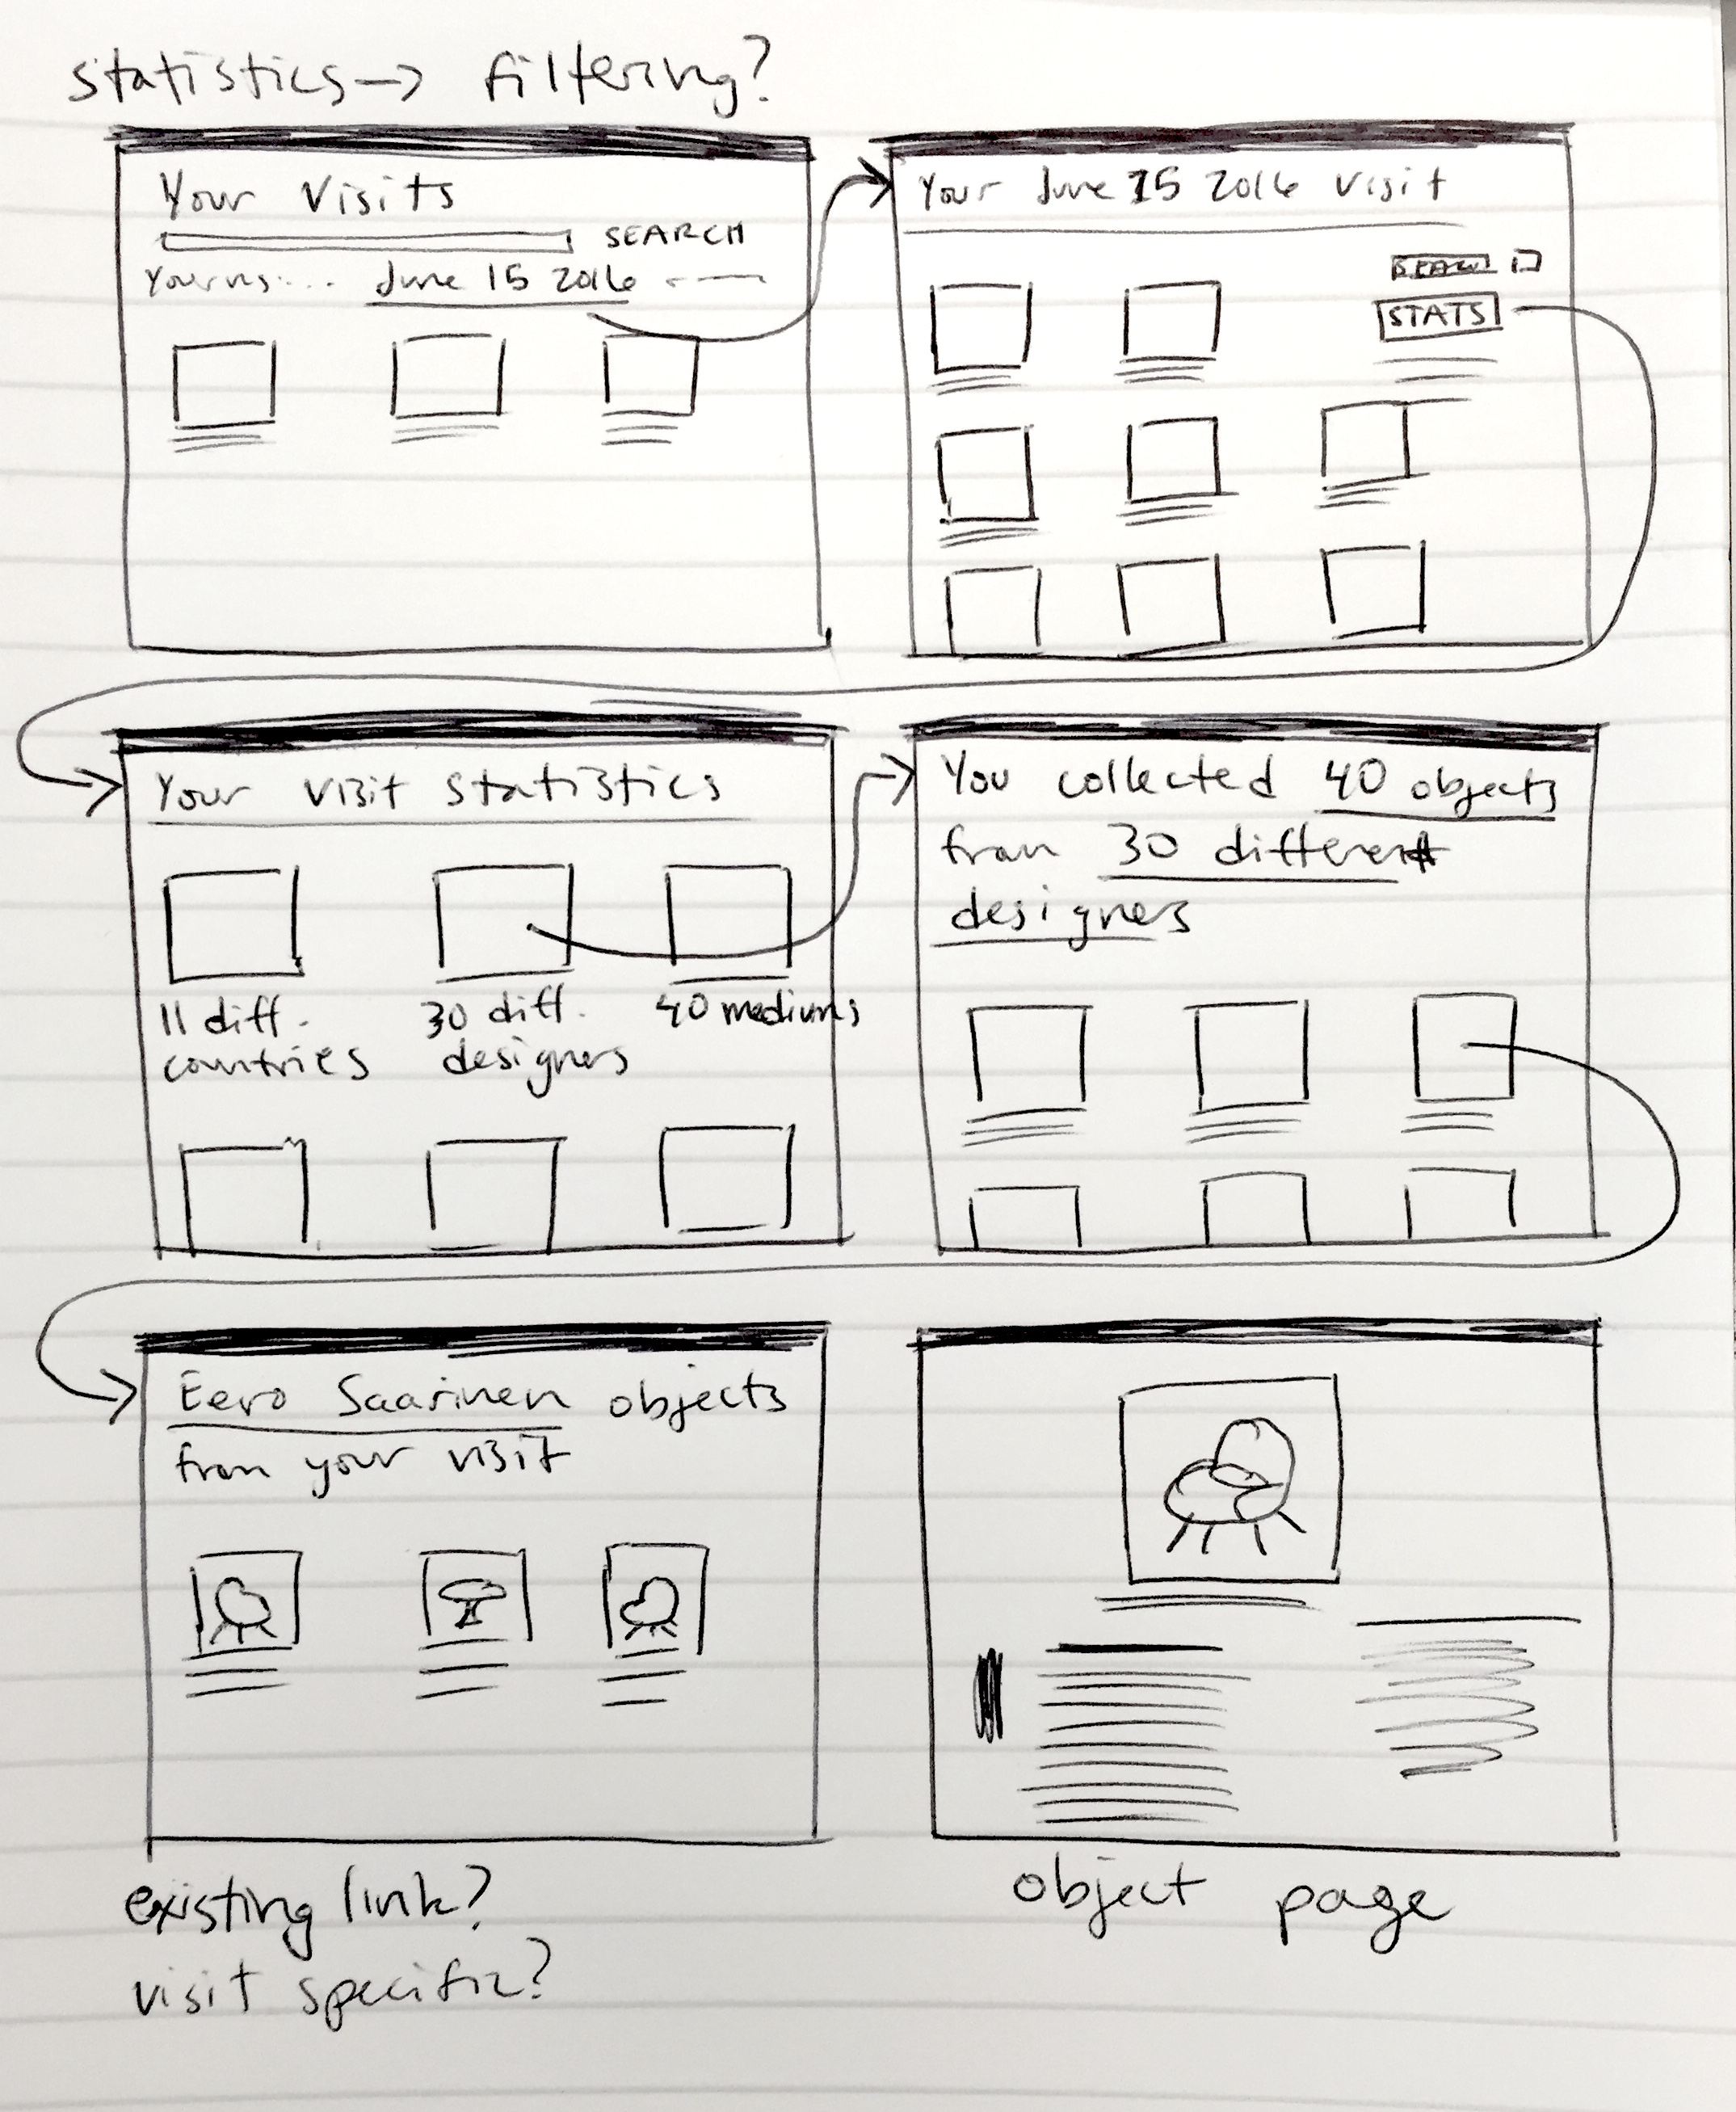
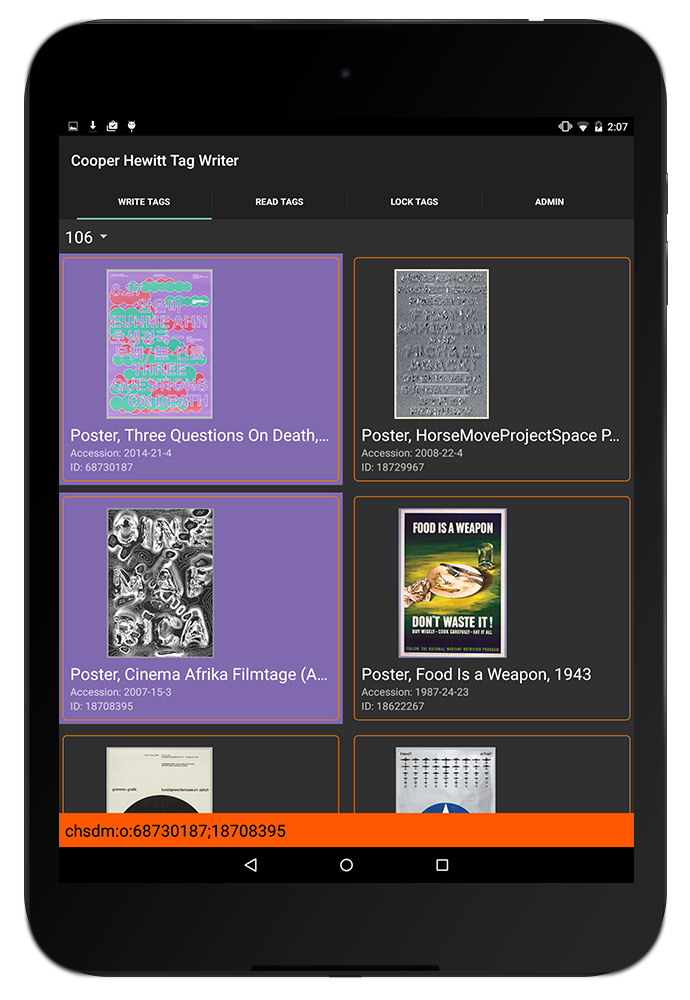
Early user flow sketch of image-based object filtering.
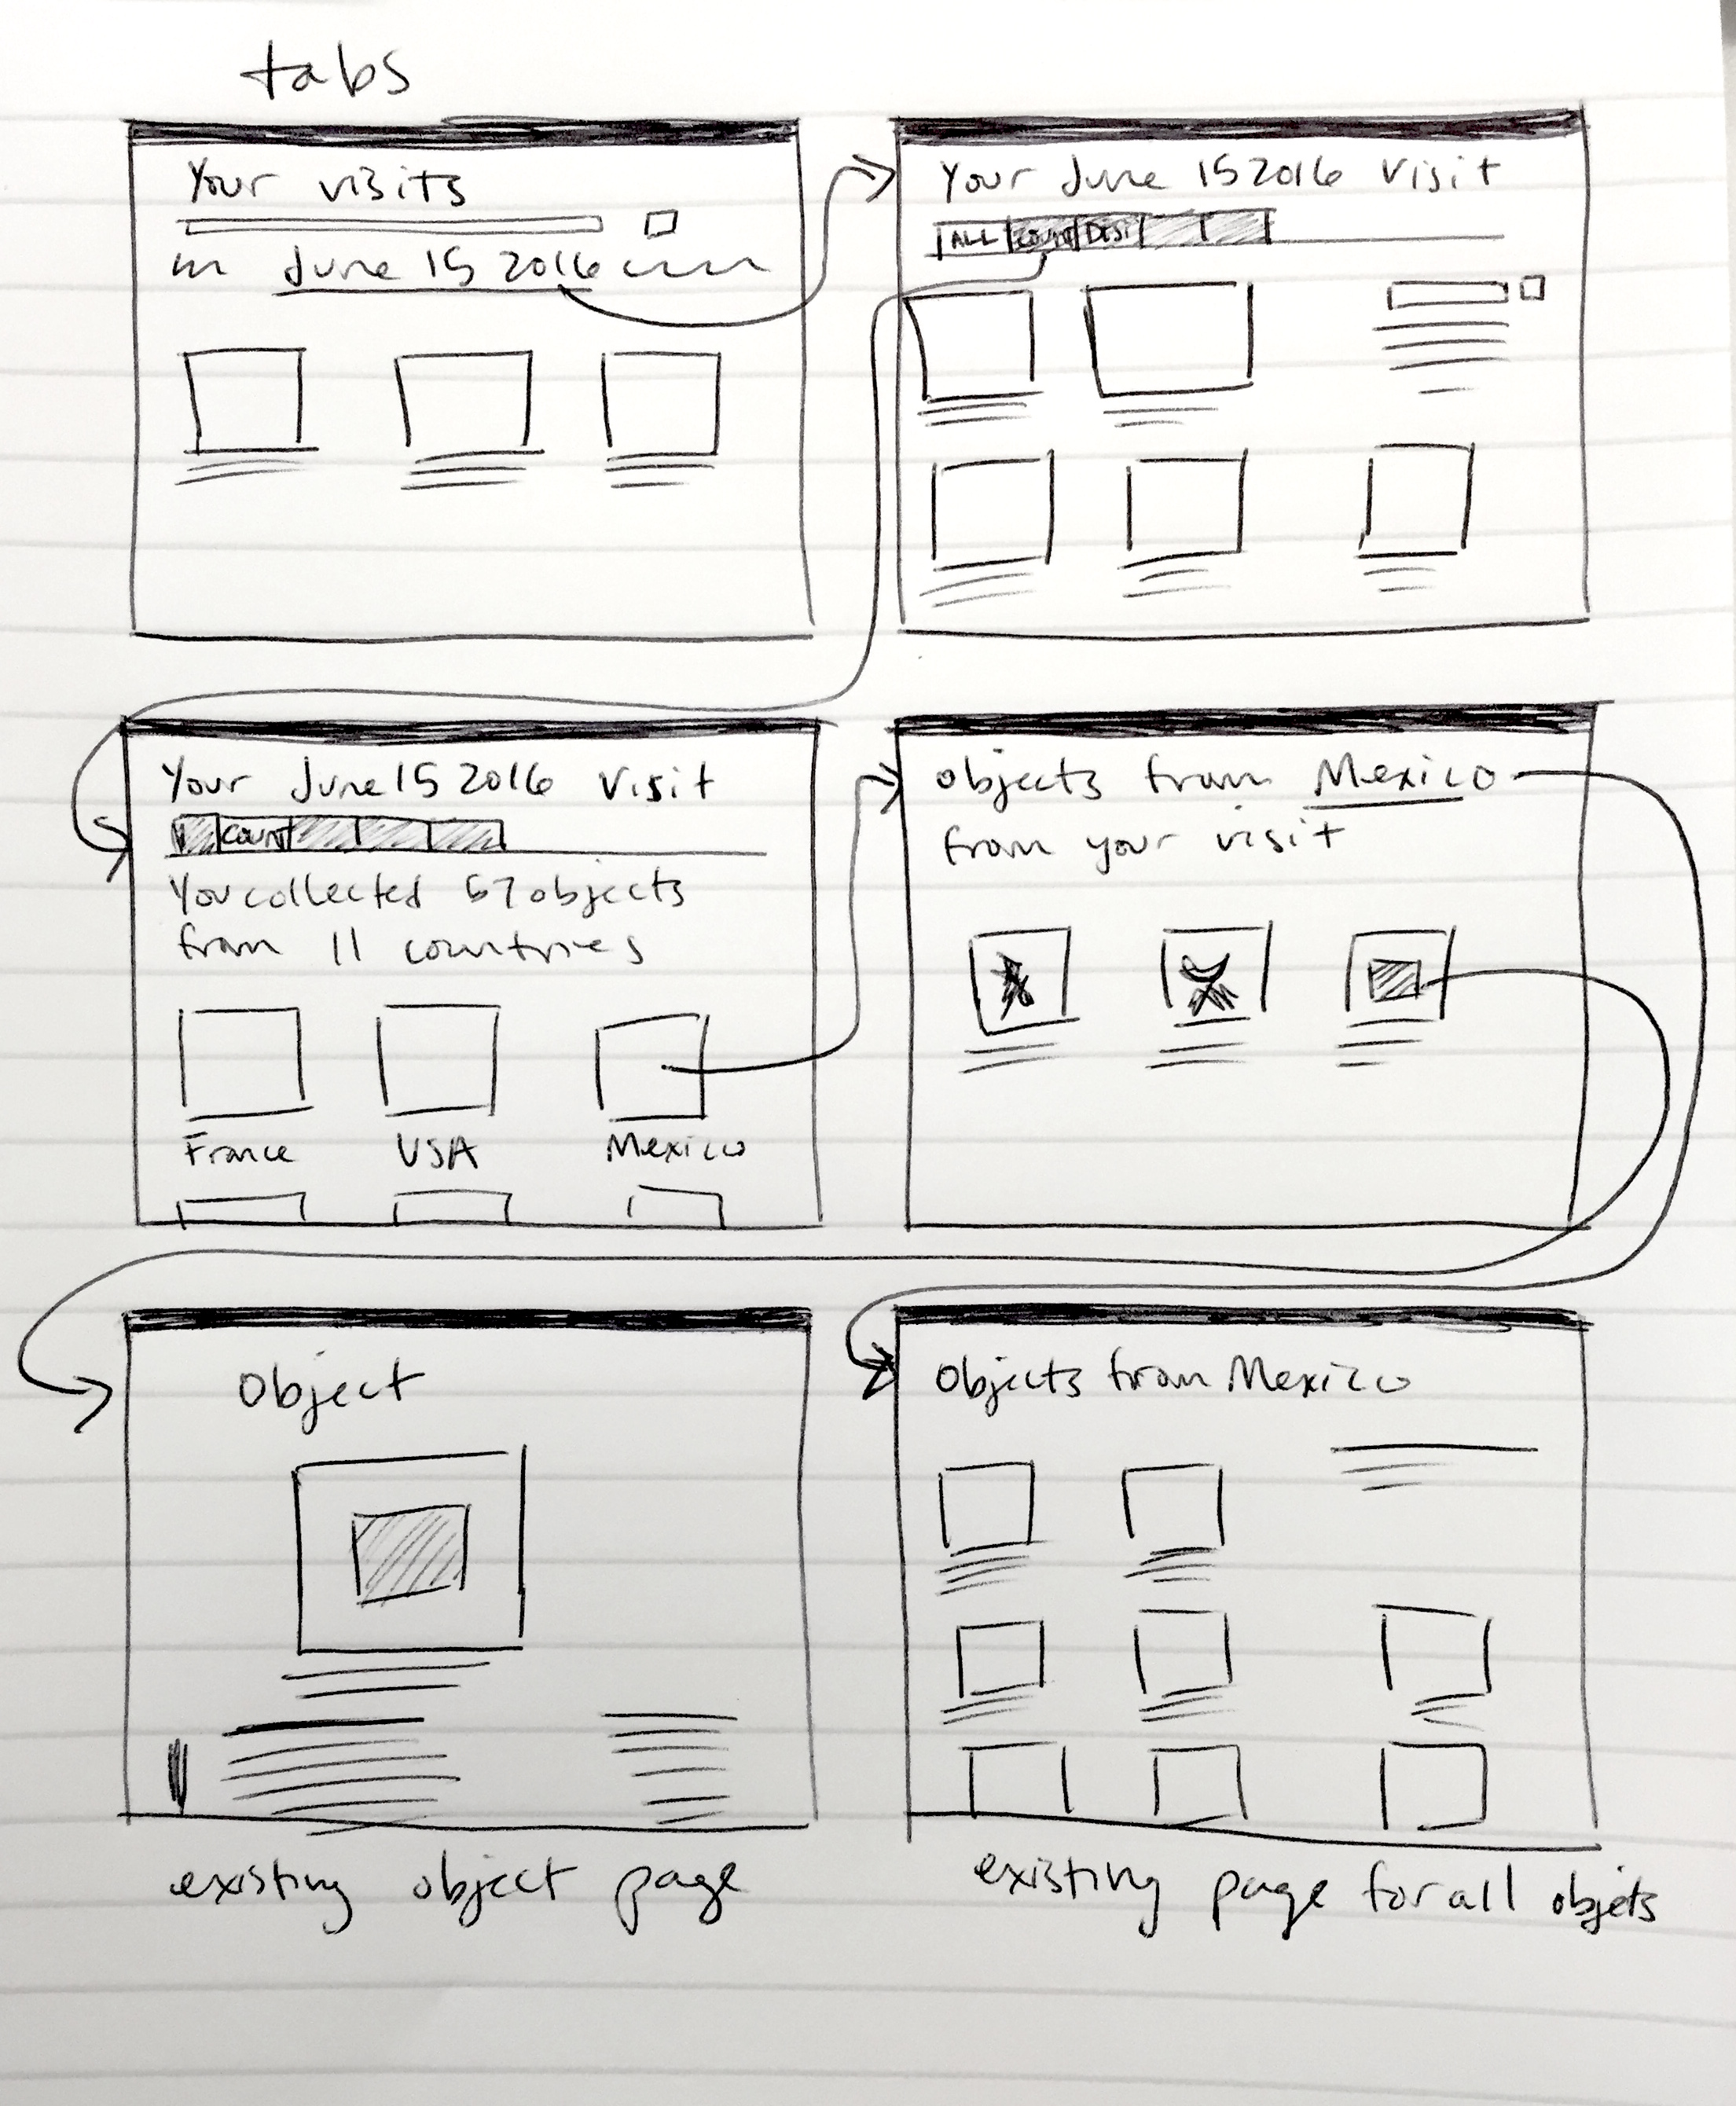
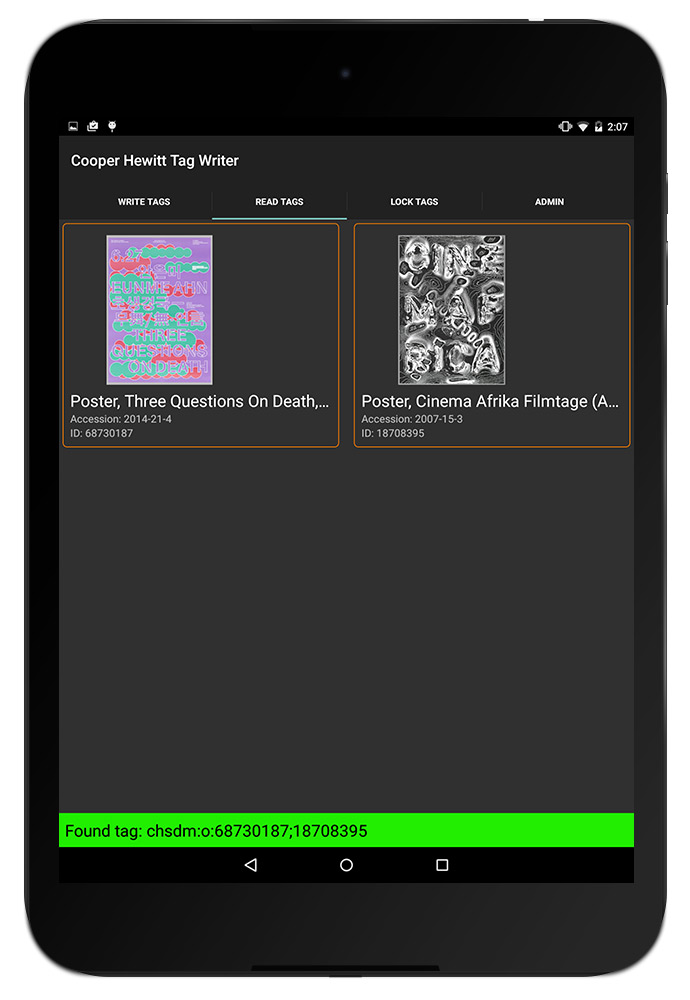
User flow sketch of visit filtering with tab UI.
As I developed a design strategy, I browsed through Cooper Hewitt’s GitHub and tried to familiarize myself with the codebase. To build the visit stats page I learned PHP and Emacs, Labs’ text editor of choice. I slowly navigated foreign PHP files and, bit by bit, built up my page with PHP and Smarty, a PHP templating engine.
The first iteration of my page took about three days to complete and was not interactive. I focused on calculating specific values from PHP and sending them to the template. And while I was very proud of myself for finally figuring out how for loops work in PHP, I knew that the main goal for my page was to encourage exploration of Cooper Hewitt’s vast collection, with a user’s visit only acting as a starting point. So next I added links to everything that already had a linkable page: countries, people, colors, and tags. While searching the existing Cooper Hewitt codebase, I serendipitously found a PHP file that collected all colors in all of a user’s visits, along with the objects associated with each color. With a little massaging, I was able to use that code to make a page that only shows the colors associated with a specific visit. I linked this to the visit statistics page so then the user could see a nice tag-cloud-like page of colors and the number of objects associated with each color.
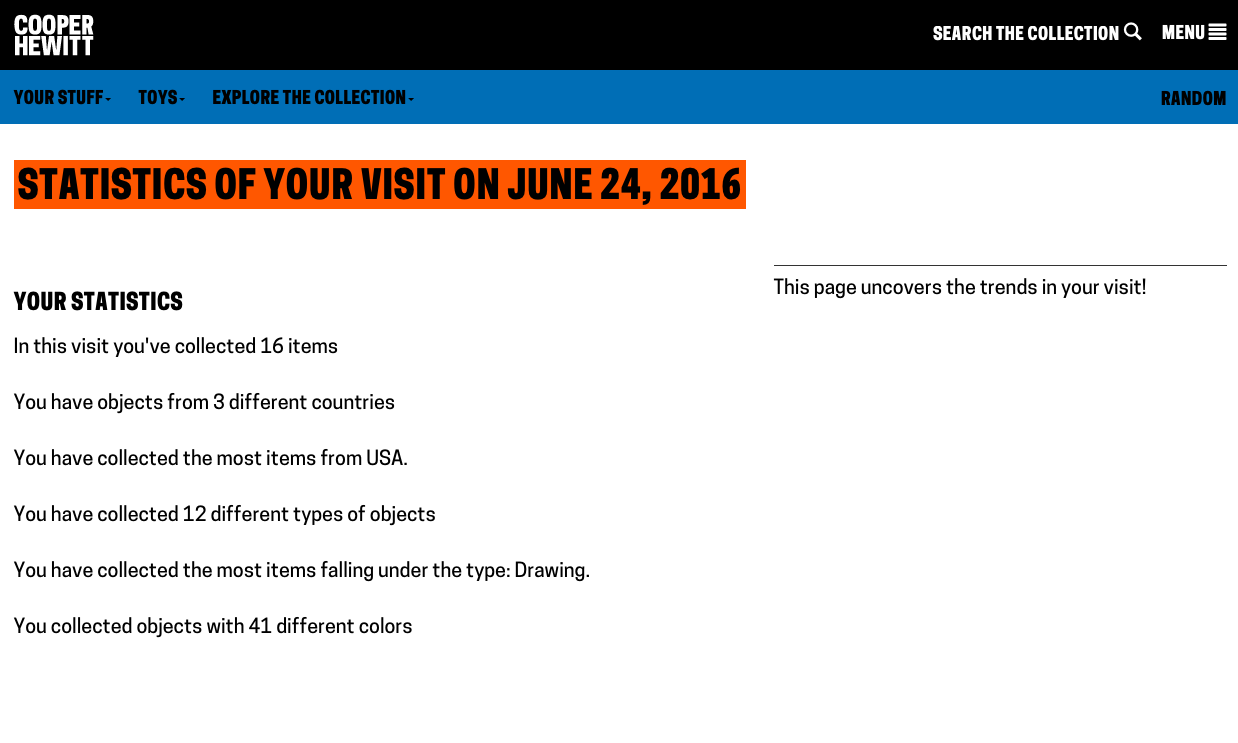
The beginnings of the visit statistics page.
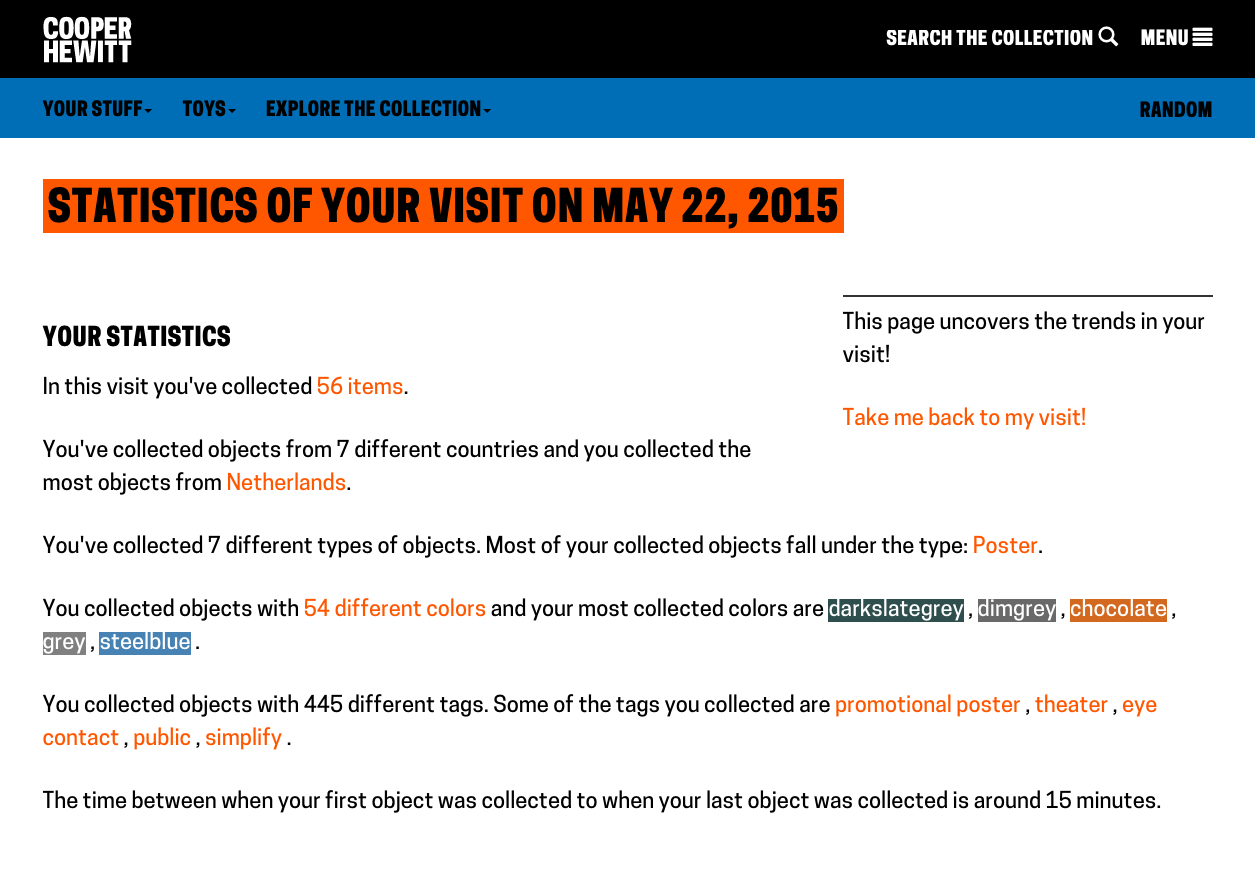
The first public version of the visit statistics page.
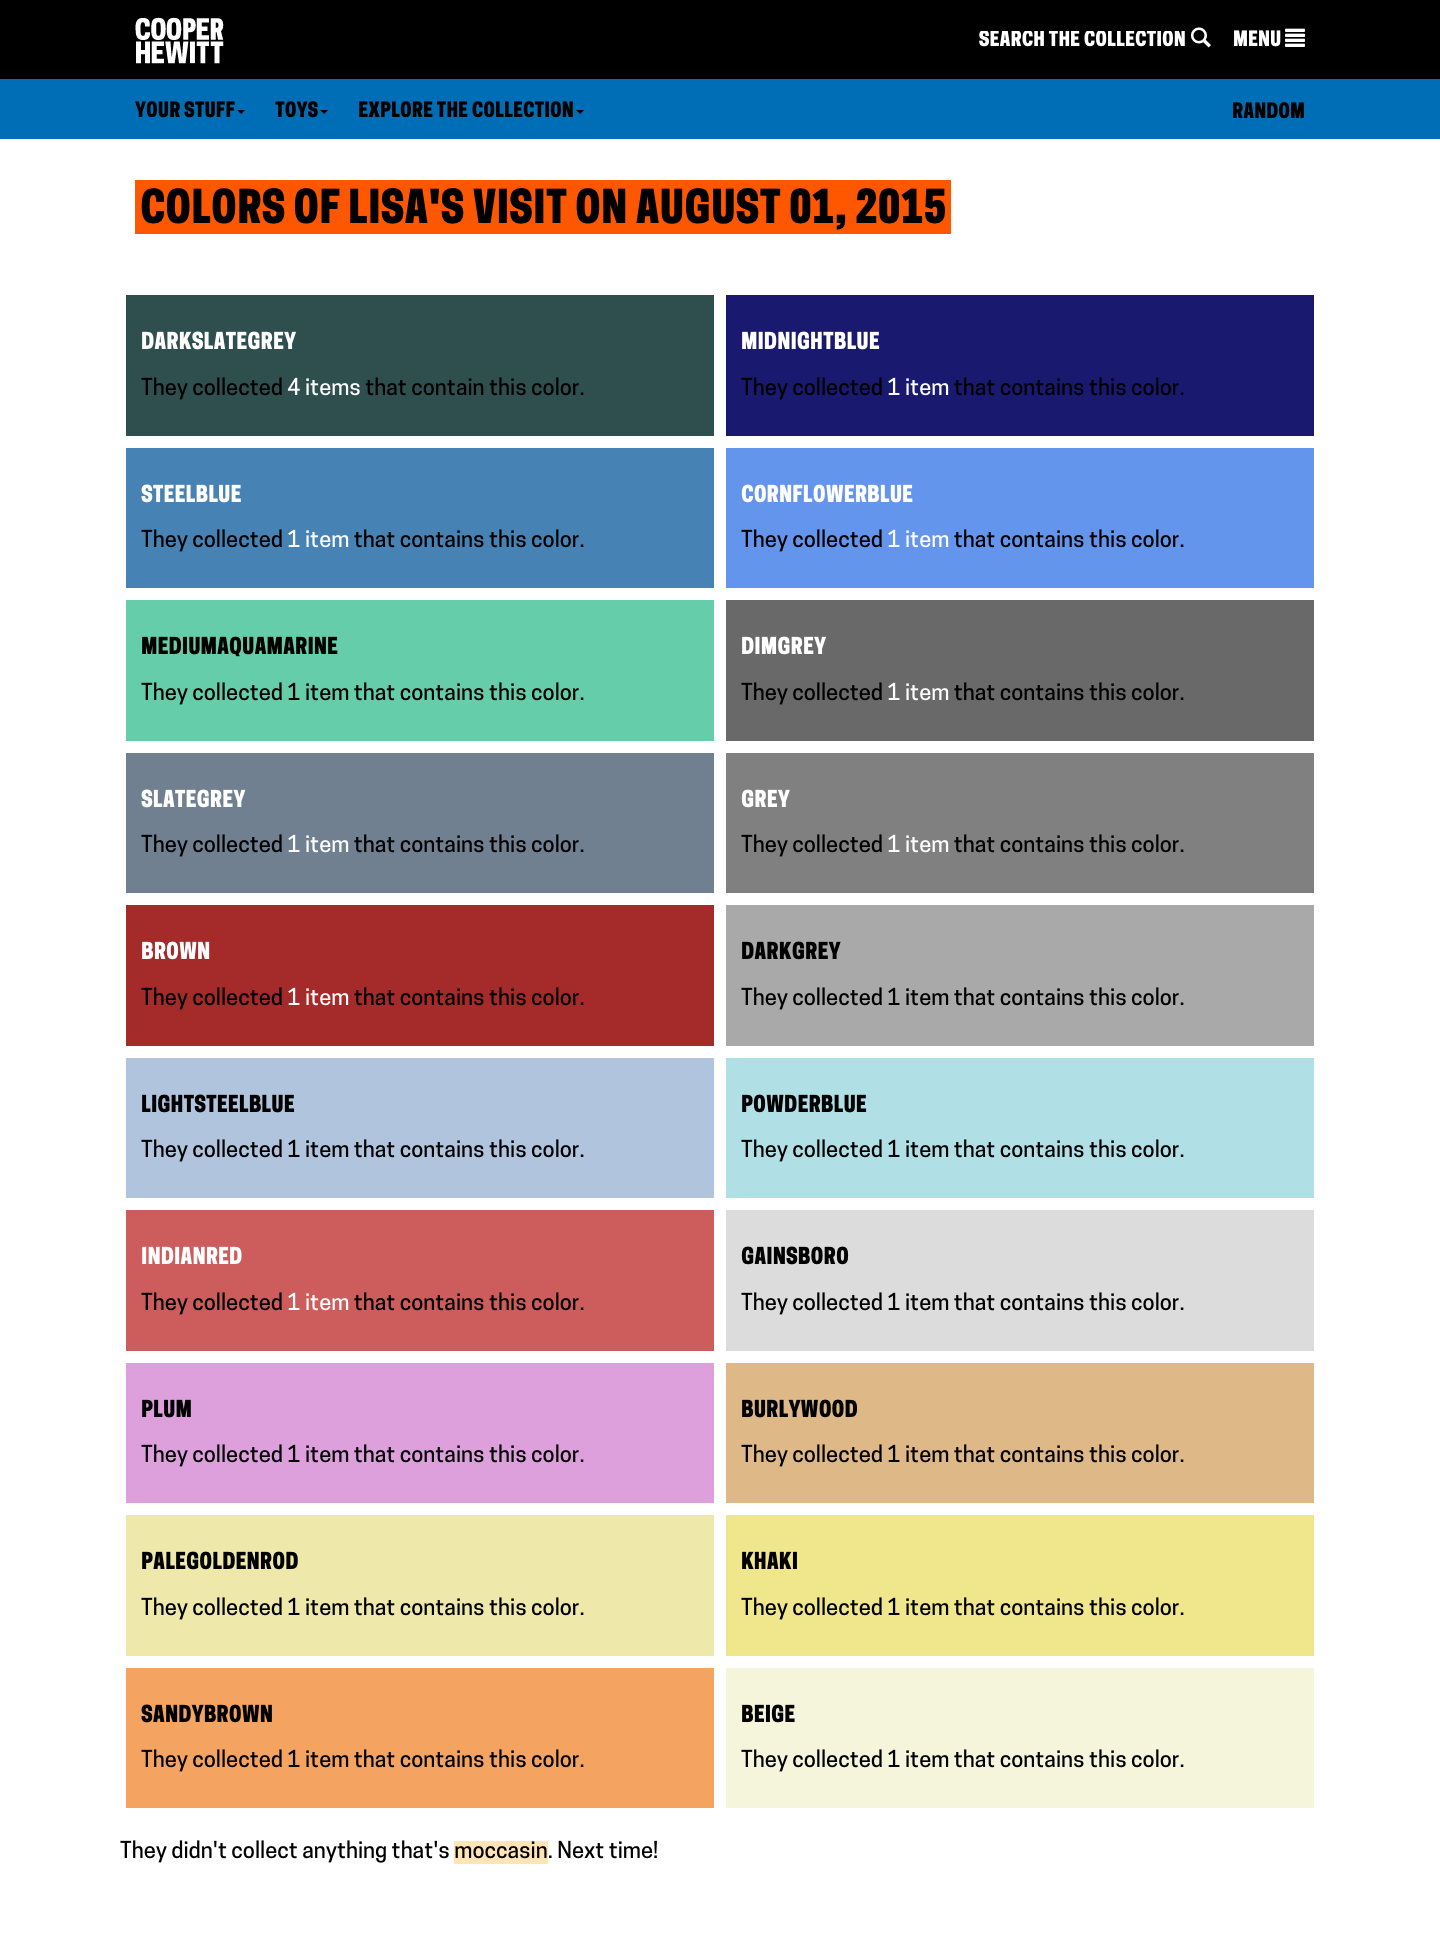
The visit colors page of a small but colorful visit.
Next, I deployed the second iteration of the visit stats page—text-based presentation of visit data and links to the collection—to the production website and shared it with my friends and family. And to my surprise, it actually worked! Or so I thought, but I’ll explain that later.
My next step was to add some visualization. Chart.js makes it easy to create beautiful interactive graphs that are perfect for the data I wanted to display. Building on the implementation of Chart.js on some internal administrative pages on the collections website, I created a graph that shows how a user interacted with objects in the gallery.
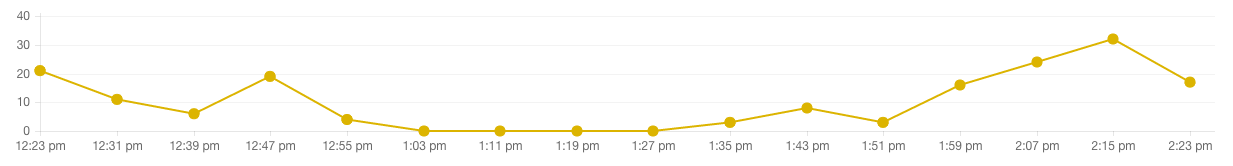
A graph showing the collecting activity of a visit. The y-axis is number of objects and the x-axis is time. This visit has 164 items collected over 2 hours.
Memory Issues
To test this iteration of the statistics page, which included links and a Chart.js graph, I used a larger visit with almost 200 objects. I clicked the link to the statistics page and… it didn’t load. I quickly realized that I naively only tested the statistics page on smaller visits (fewer than 60 objects) and the stats page had too much data crunching for visits over 150 objects. After some digging in the logs, Micah and I discovered there was an issue with the amount of memory the page was using. We discovered a useful built-in PHP function called memory_get_usage(), which tells you the number of bytes used in a file. With this, we discovered that for a visit of over 160 objects, the stats page totaled almost 60 MB of memory usage. A typical page (for example, the visit page for a single visit) is around 1-2 MB of memory.
I first thought that the many for loops and multi-dimensional arrays utilized in my code for gathering data were the culprit of this memory issue. After some debugging, I discovered the function which inflates each object in a user’s visit (a.k.a. gathers every single bit of metadata available about that object from MySQL) was taking up close to 95% of the page’s total memory. This function returns a giant multi-dimensional array, which the page iterates over many many times to pick out the necessary data. This gathering of information from MySQL, along with the many for loops going through it, caused my page to be slowed down by getting and storing a ton of information that it didn’t even need.
So, I tried cutting down that array by adding conditionals to the function that inflates each object. I pared down each object’s entry in the array to get the minimum amount of information from MySQL. This way, I was able to decrease the amount of memory used by the page by a few MB. But this still didn’t resolve the memory issue. While the page itself wasn’t using as much memory, the memory used up by helper functions and other functions within functions called on my page were still contributing to the memory used. So Micah and I brainstormed and brainstormed until we thought of two possible options: 1. Create a task for the offline server, which would require a lot of difficult coding and setting up which we both didn’t quite know how to do or 2. Use Elasticsearch to get exactly the data needed for the stats page—which I kind of knew how to do after minor exposure to Elasticsearch—but I would need to go through trial and error to fully figure out. I would also need to edit all of the existing code for the stats page to work with the results from Elasticsearch. I chose option two, because from a user experience standpoint it would be disappointing to go to the stats page and just see a message saying “Oops, give us a minute, we are working on getting the information for you”.
To work with Elasticsearch I had to figure out how it builds queries and aggregates responses. After a lot of trial and error, I figured out what terms Elasticsearch accepts and what it doesn’t. This newly built query returned the minimum amount of information I needed for the statistics page and was way faster than getting a huge multi-dimensional array from MySQL. Then, all I had to do was alter a few lines in my existing code to navigate through the new Elasticsearch response. A few bug fixes later and the statistics page was working better than it was pre-Elasticsearch. After this implementation of Elasticsearch the total memory used (as found by memory_get_usage()) was down to 4 MB! Roughly a 90% decrease in memory usage simply by changing the way I got the necessary data. And, for the moment of truth, when I tested the stats page on the visit that consists of almost 200 objects—it loaded! And it loaded quickly! Now for comparison, before Elasticsearch, a short visit would take 2-3 seconds to load, which isn’t terrible but definitely not ideal. A larger visit could take upward of 10 seconds, which is absolutely too slow. At that point, the server timed out and the page would not load at all. Now, on first load, the stats page for a 200 object visit is just over a second, and is under a second when accessed again with a cache.
What’s Next?
Although the page is at a good resting point currently, I could see some improvements being made in the future, such as the addition of more links, graphs, data, and fine tuning my code.
One of the biggest things relating to this project that I could see in the future is another page to view the statistics of a user’s shoebox, that is, the combination of all of a user’s visits. A statistics page that spans all visits would be more powerful for someone who wants to see overall trends in their collections.
A simpler addition would be to make more pages, similar to the separate “Colors Of Your Visit” page, that show a complete list of the countries, people, and tags a user collected.
Another potential feature would be a world map showing one’s collected objects. It would be a great visual addition to a text-based page showing all of the countries from which a user collected objects. Something like this could be added to the separate page reserved for listing all of the countries in a visit.
It could be a cool experiment to give a little feedback to a user about their collecting habits, to make museum go-ers more aware of how they interacted with the pen and the items in the galleries. Perhaps a user who collected a lot of stuff at the beginning and then tapered off would get a short message below their graph: “It looks like you stopped collecting items toward the end of your visit!” Maybe someone who collected only five objects in a two hour period would get “You didn’t use your pen much during your visit,” or someone who collected 300 objects in one hour would see “Wow! You’re quite the treasure hunter!” This idea also demonstrates the fine line between responsive and creepy, which I struggled with while deciding on phrasing throughout my page.
Cooper Hewitt’s Pen gives us so much information about a user’s visit and their journey through the galleries. Combined with the collection’s breadth and depth of metadata, it’s astounding how much information a user can receive about their visit and their viewing habits. My statistics page is a move toward condensing the vast amount of information available about a visit and makes it more accessible for anyone interested in learning about their interests, taste in design, or museum-going habits.
The visit statistics page is currently on the website and I encourage you to check it out for yourself by going to one of your visits and clicking the link on the right that says “View your visit stats”. Here is a link to some of my visits and here are some cool examples using visits from people at Cooper Hewitt Labs:

A statistics page from one of my own visits.
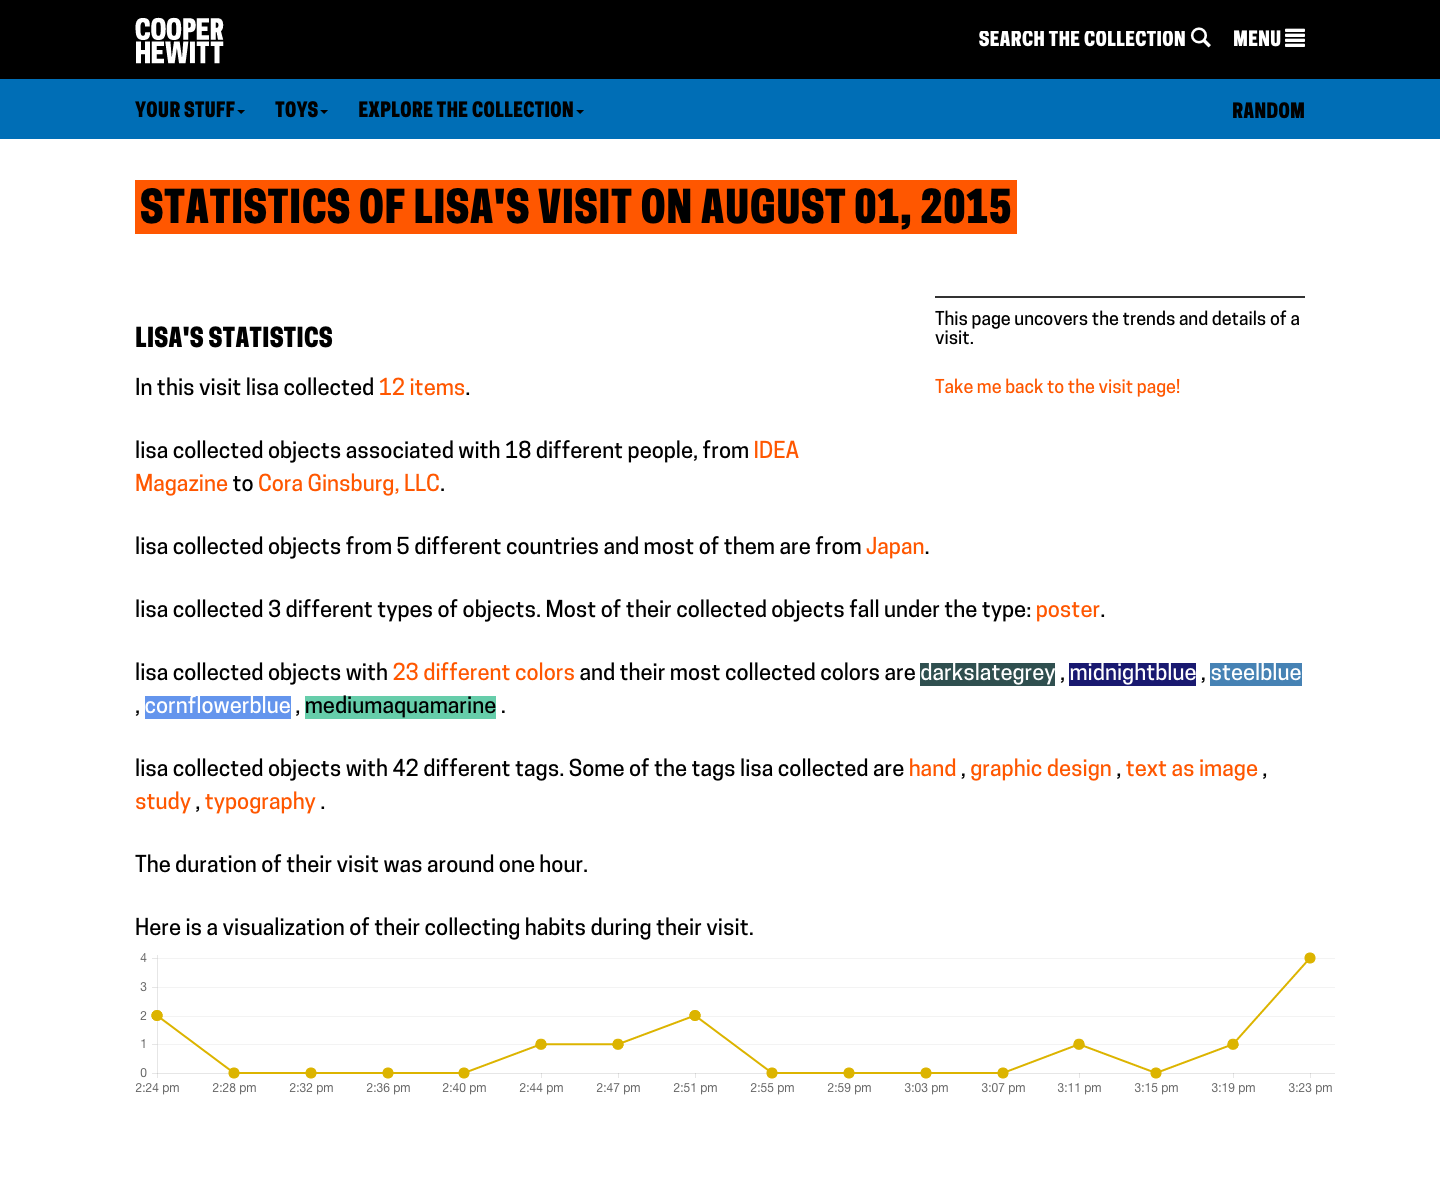
A colorful visit from Lisa.
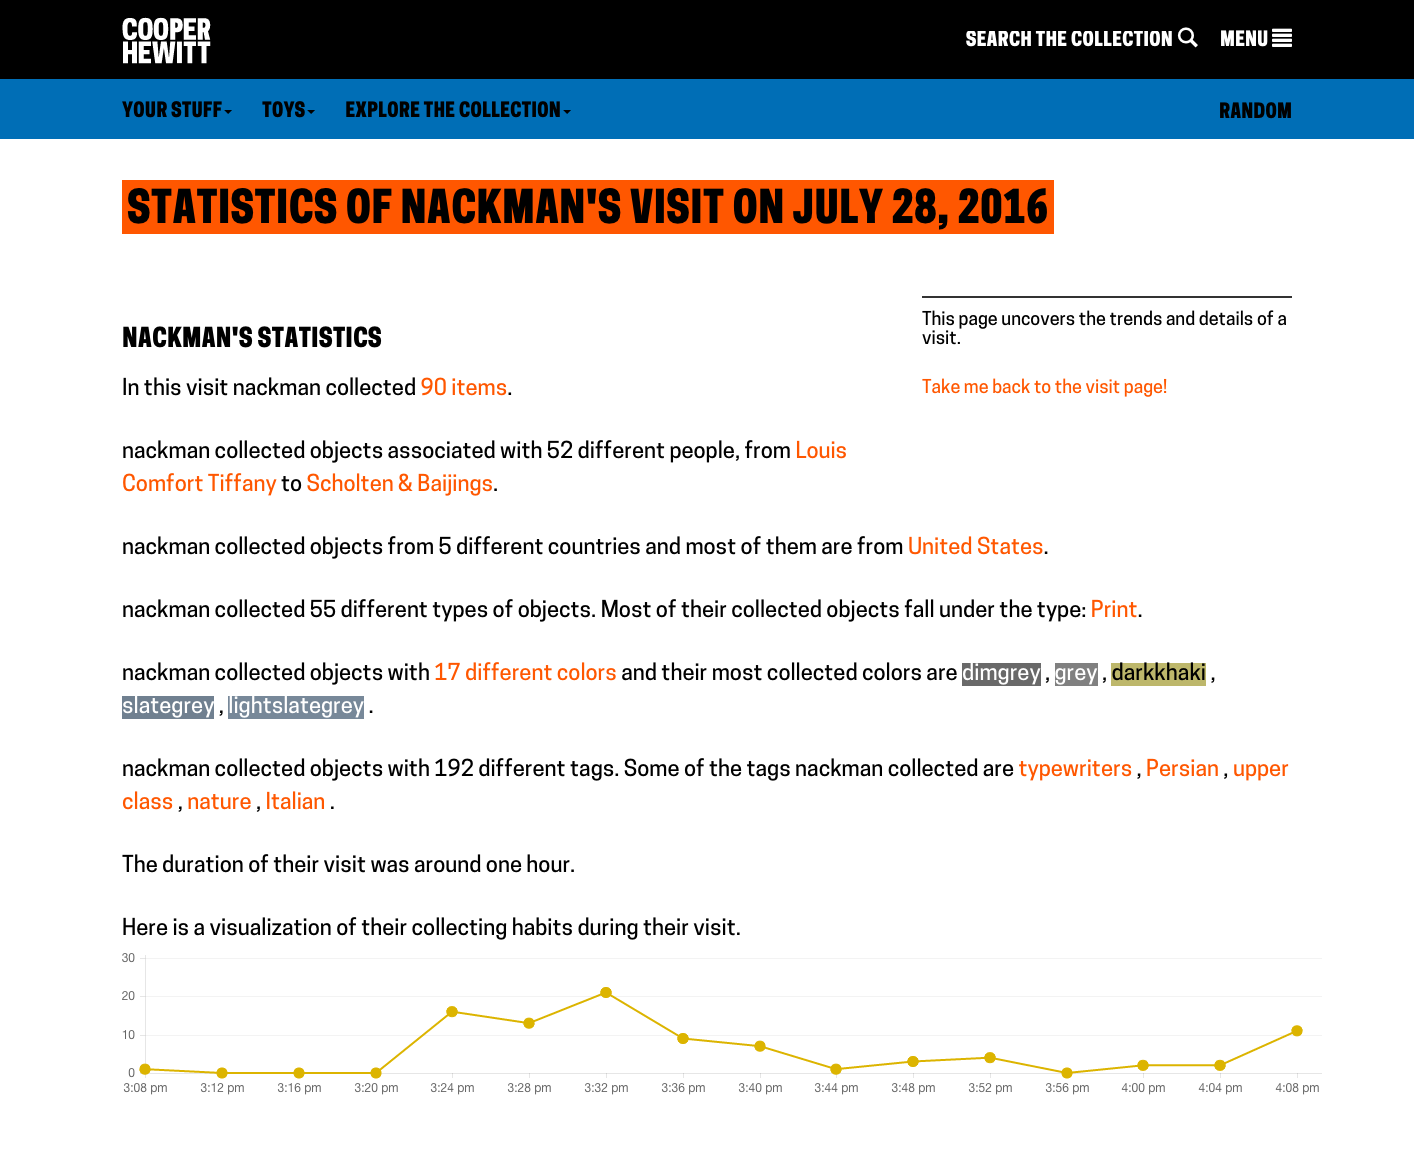
A visit from Rachel, the Labs’ new interactive media developer.