Since reopening in December 2014, we’ve found that the coming opening of an exhibition is a big driver of iteration. The work involved in preparing an exhibition involves the whole museum and is one of the most coordinated and planned-out things we do, and because of this, new exhibitions push us to improve in a number of ways.
First, new exhibitions can highlight existing gaps or inefficiencies in our systems. Our tagging tool, for example, always sees a round of bug fixes or new features before an exhibition because it coincides with a time when it will see heavy use. Second, exhibitions present us with new technical challenges. Objects in the Heatherwick exhibition, for example, were displayed in the galleries grouped into “projects,” which is also how we wanted users to collect them with their Pens and view them on the website. To accomplish this we had to figure out a way that TMS, our collections management software, could store both the individual objects (for internal purposes) and the grouped projects (which would hold all the public-facing images and text), and figure out how to see that through to the website in a way that made registrars, curators and ourselves comfortable. Finally, a new exhibition can present an opportunity for experimentation. David Adjaye Selects gave us the opportunity to scale up Object Phone, a telephone-based riff on the audio guide, which originally started as a small, rough prototype.
Last week was the opening of our triennial exhibition “Beauty,” which similarly presented us with a number of technical challenges and opportunities to experiment. In this post I’ll share some of those challenges and the work we did to approach them.
Collecting Exhibition Text
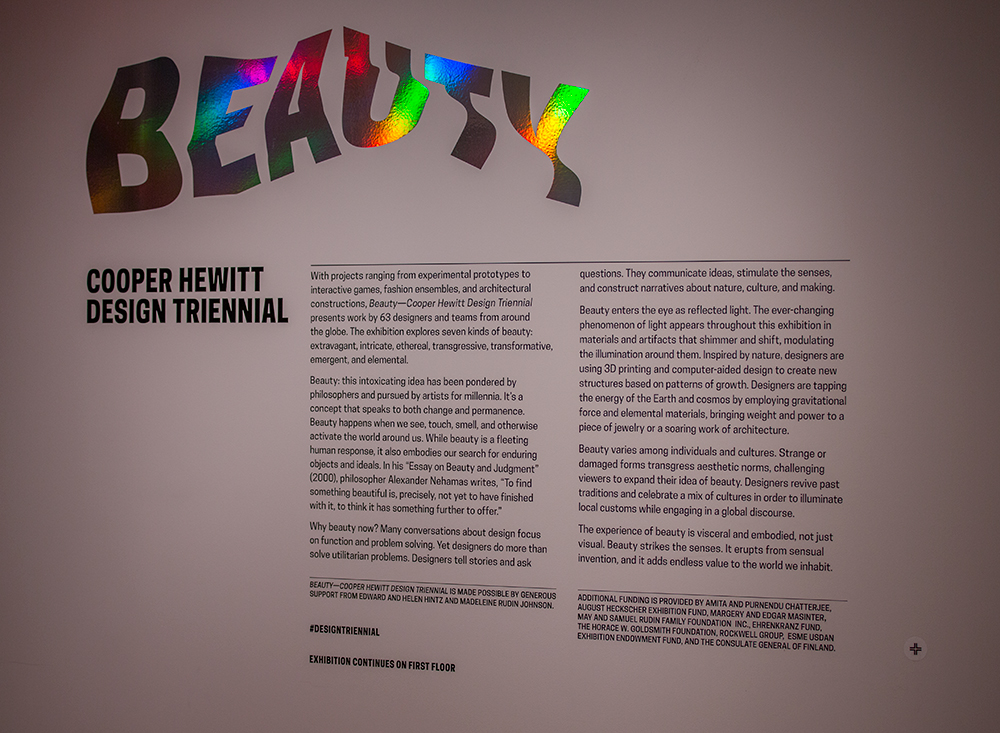
Triennial’s wall text, with the collect icon in the lower-right corner
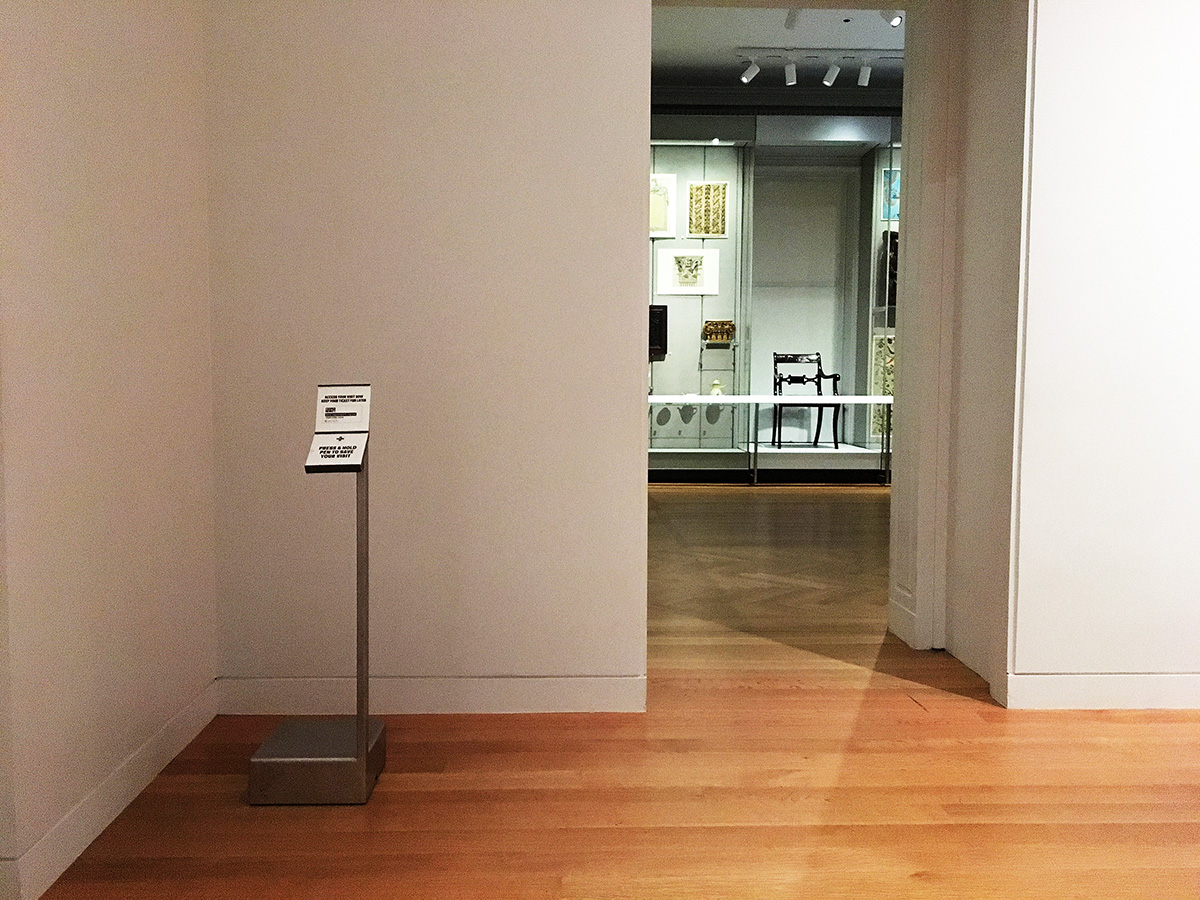
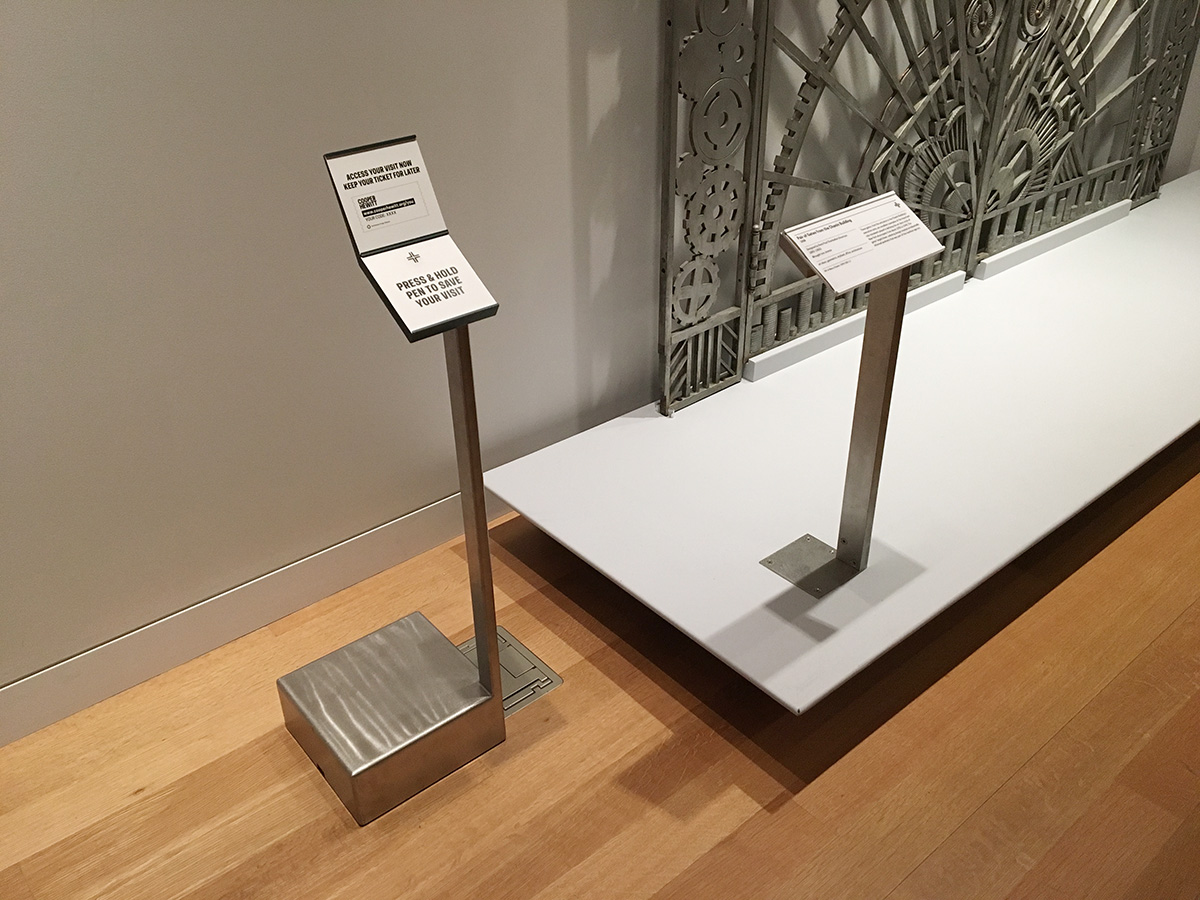
Since the beginning of the pen project we’ve been saying that the Pens don’t just have to collect objects. Aaron and Seb wrote in their paper on the project that “nothing would prevent the museum from allowing visitors to ‘collect’ individual designers, entire exhibitions or even architectural elements from the building itself in the future.” To that end, we’ve experimented with collecting shop items and decided that with the triennial we would allow visitors to collect exhibition text as well.
Exhibition text (in museum argot, “A-Panel” is the main text at the beginning of an exhibition and “B-Panel” are any additional texts you might find along the way) makes total sense as something that a visitor should be able to remember for later. It explains and contextualizes an exhibition’s goals, contents and organization. We’ve had the text on our collections since we reopened but it took a few clicks to get through from a visitor’s post-visit website. Now, the text will be right there alongside all of a visitor’s objects.
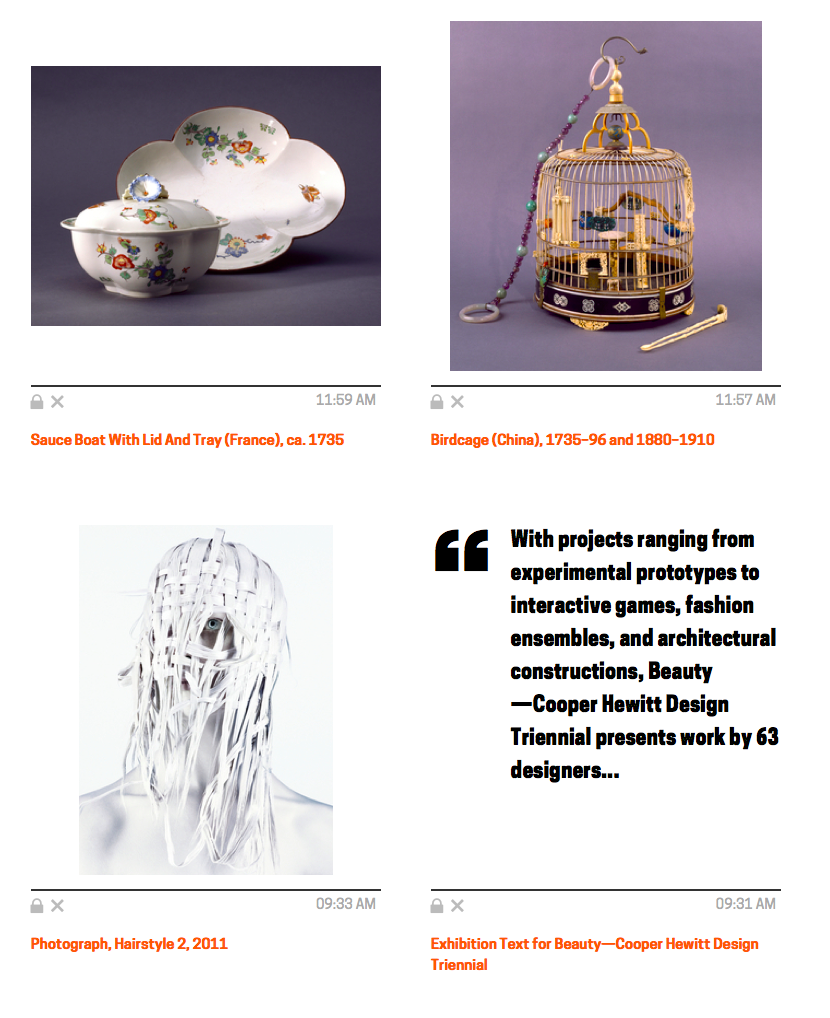
The exhibition text on a post-visit website
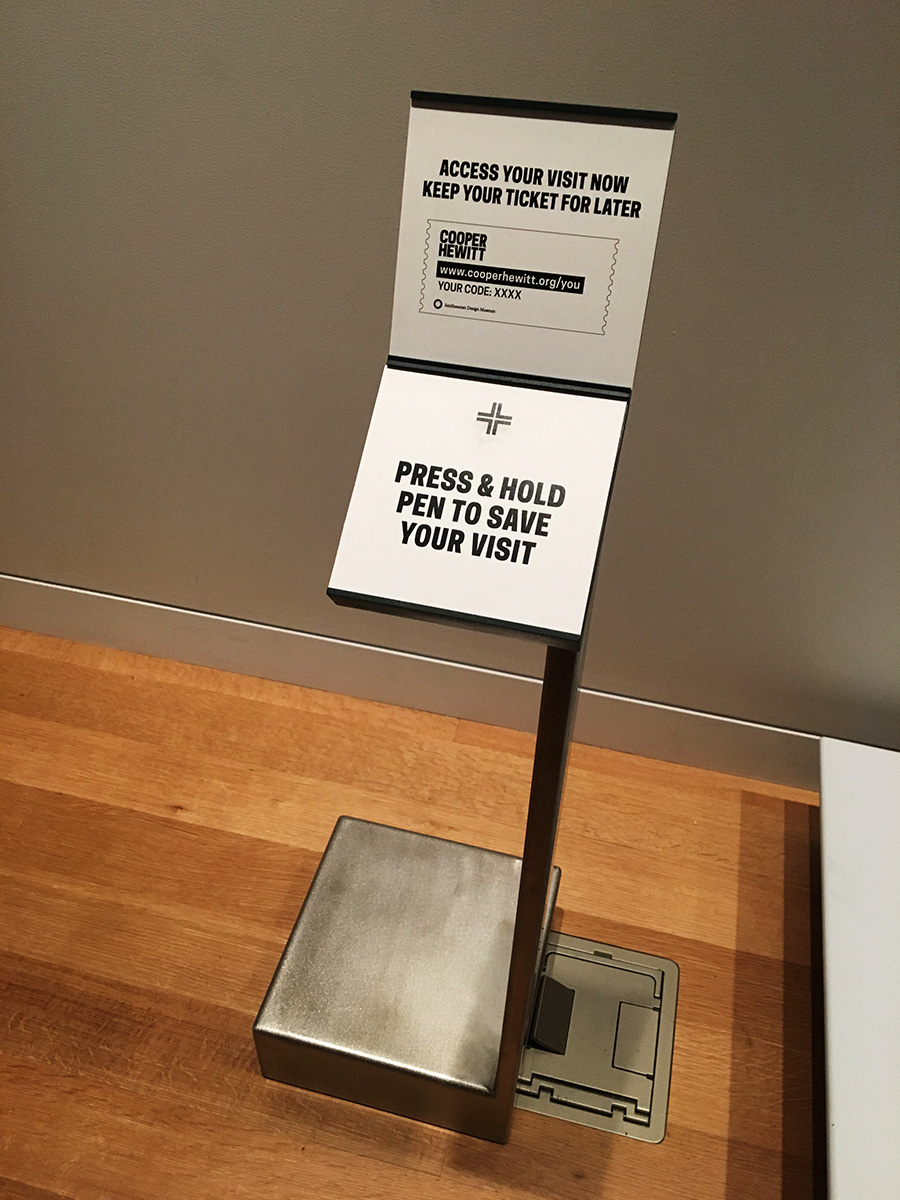
The open-ended part of this is what visitors will expect when they collect an “exhibition.” We installed the collection points with no helper text, i.e. it doesn’t say “press here to collect this exhibition’s text.” We think it’s clear that the crosshairs refer to the text, but one of our original ideas was that we could have a way for the visitor to automatically collect every object in the exhibition and I wonder if that might be the implied function of the text tag. We will have to observe and adapt accordingly on that point.
Videos Instead of Images
When we first added videos to our collections site, we found that the fastest way to accomplish what we needed was to use TMS for relating videos to objects but use custom software for the formatting and uploading of the videos. We generate four versions of every video file — subtitled and not subtitled at two resolutions each — which we use in the galleries, on the tables and on the website. One of the weaknesses of this pipeline is that because the videos don’t live in the usual asset repository the way all of our images do, the link between TMS and the actual file’s location is made by nothing more than a “magic string” and a bit of guesswork. This makes it difficult to work with the video records in TMS: users get no preview and it can be difficult to know which video ID refers to which specific video. All of this is something we’ll be taking another look at in the near future, but there is one small chunk of this problem we approached in advance of the Triennial: how to make our website show the video in place of the primary image if it would be more appropriate to do so.
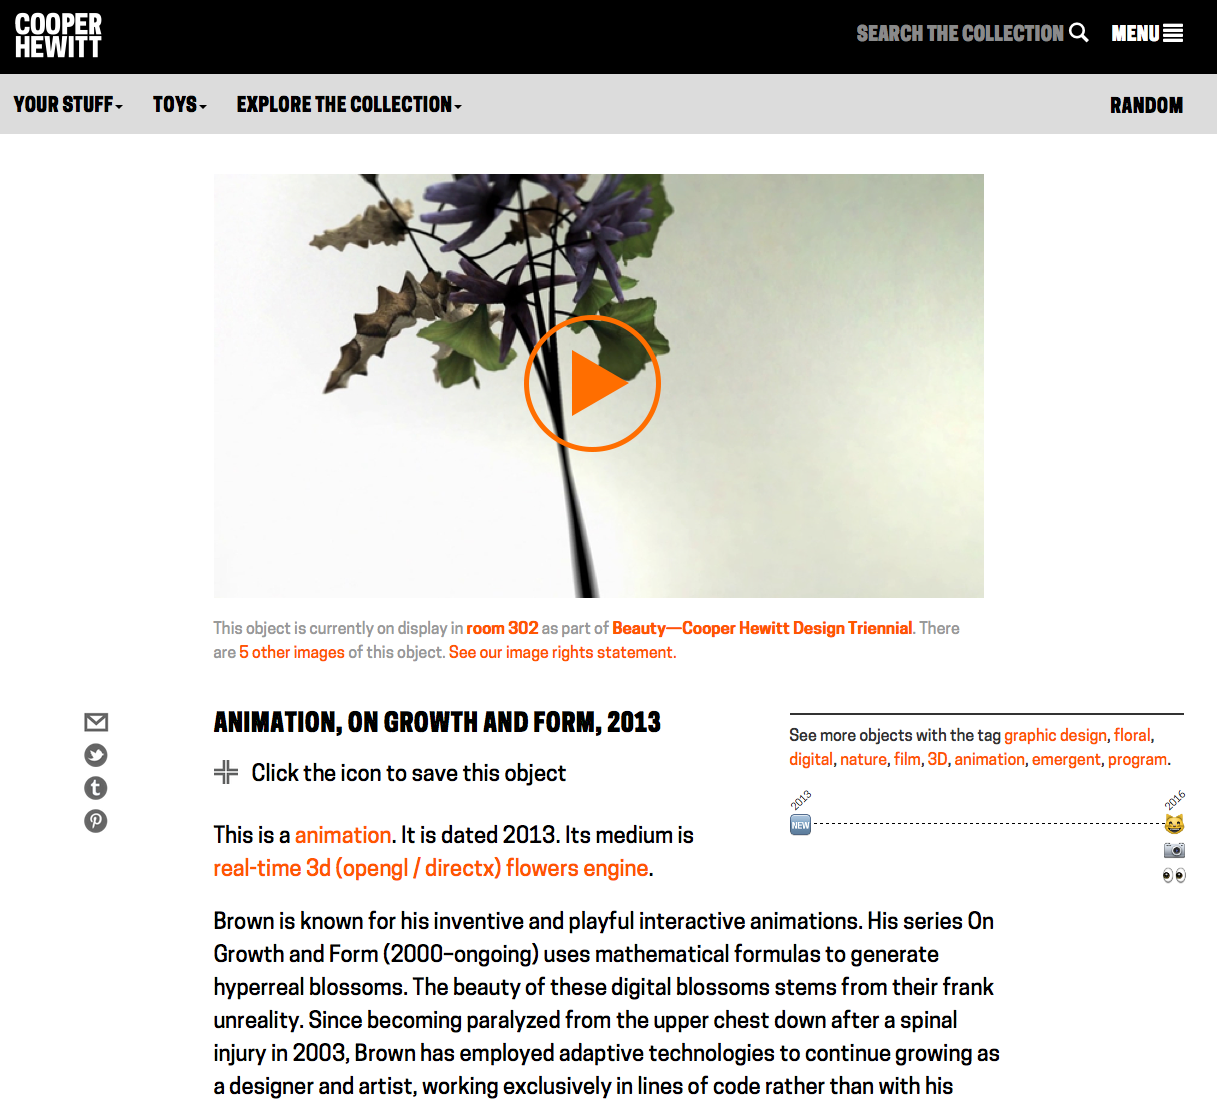
Here’s an example. Daniel Brown’s On Growth and Form is an animation on display in the Triennial. Before, it would have looked like this — the primary image is a still rendering that has been added in TMS, and the video appears as related content further down the page.
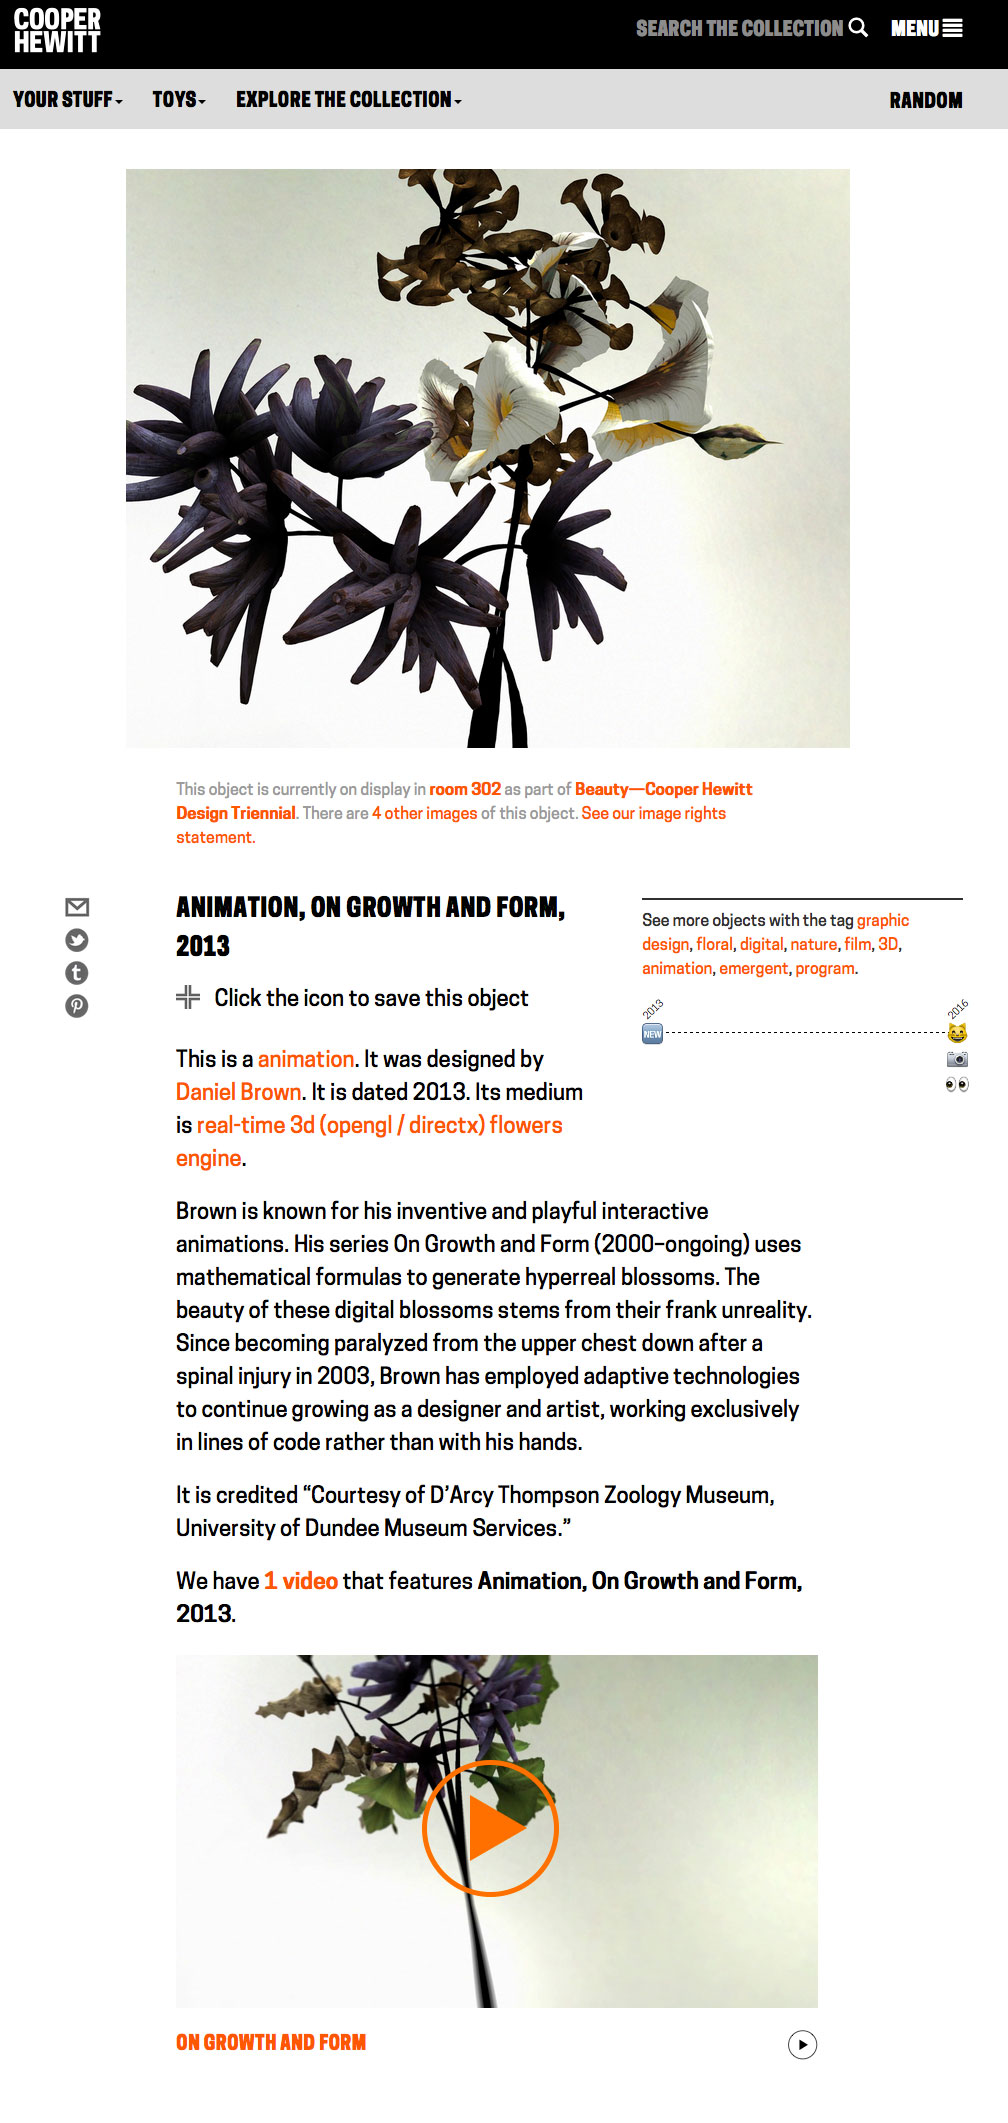
What we did is to say if the object is itself a video, animation or other screen-based media and we have an associated video record linked to the object, remove the primary image and put the video there instead. That looks like this:
Like all good iterations, this one opened up a bunch of next steps. First, we need to figure out how to add videos into our main digital asset pipeline so that the guesswork can be removed from picking primary videos and a curator or image specialist can select it as “primary” the same way they would do with an image. Next, it brought up an item that’s been on the backburner for a while, which is a better way to display alternate images of an object. Currently, they have their own page, which gets the job done, but it would be nice to present some alternate views on the main object page as well.
Just a Reflektor Sandbox
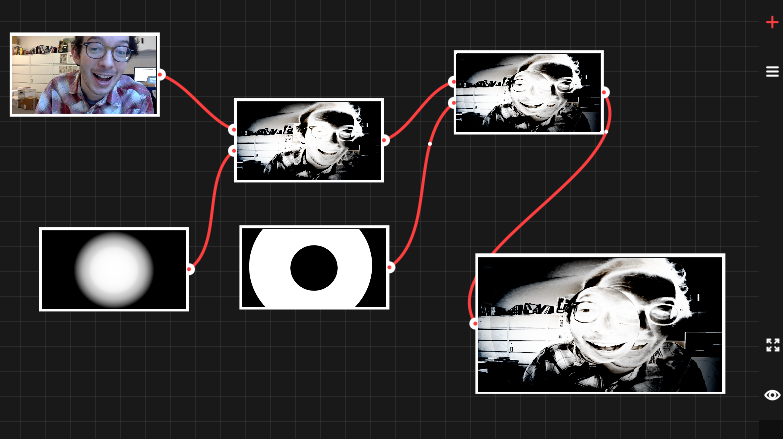
It’s fun!
We had a great opportunity to do some experimentation on our collections site due to the inclusion of Aaron Koblin and Vincent Morisset’s interactive video for Arcade Fire’s Just a Reflektor. The project’s source code is already available online and contains a “sandbox” environment, a tool that demonstrates some of the interactive visual effects created for the music video in a fun, open-ended environment. We were able to quickly adapt the sandbox’s source code to fit on our collections site so that visitors who collect the video with their Pen will be able to explore a more barebones version of the final interactive piece. You can check that out here.
Fully Loaded Labels
When we were working on the Pen prototypes, we tried six different NFC tags before getting to the one that met all of our requirements. We ended up with these NTAG203 tags whose combination of size and antenna design made them work well with our Pens and our wall labels. Their onboard memory of 144 bytes, combined with the system we devised for encoding collection data on them, meant that we could store a maximum of 11 objects on a tag. Of course we didn’t see that ever being a problem… until it was. The labels in the triennial exhibition are grouped by designer, not by object, and in some cases we have 35 objects from a designer on display that all need to be collected with one Pen press. There were two solutions: find tags with more memory (aka “throw more hardware at it”) or figure out a new way to encode the tags using fewer bytes and update the codebase to support both the new and old ways (aka “maintenance nightmare”). Fortunately for us, the NTAG216 series of tags have become more commonly available in the past year, which feature 888 bytes of memory, enough for around 70 objects on a tag. After a few rounds of end-to-end testing (writing the tag, collecting it with a pen and having it show up on the post-visit website), we rolled the new tags out to the galleries for the dozen or so “high capacity” labels.
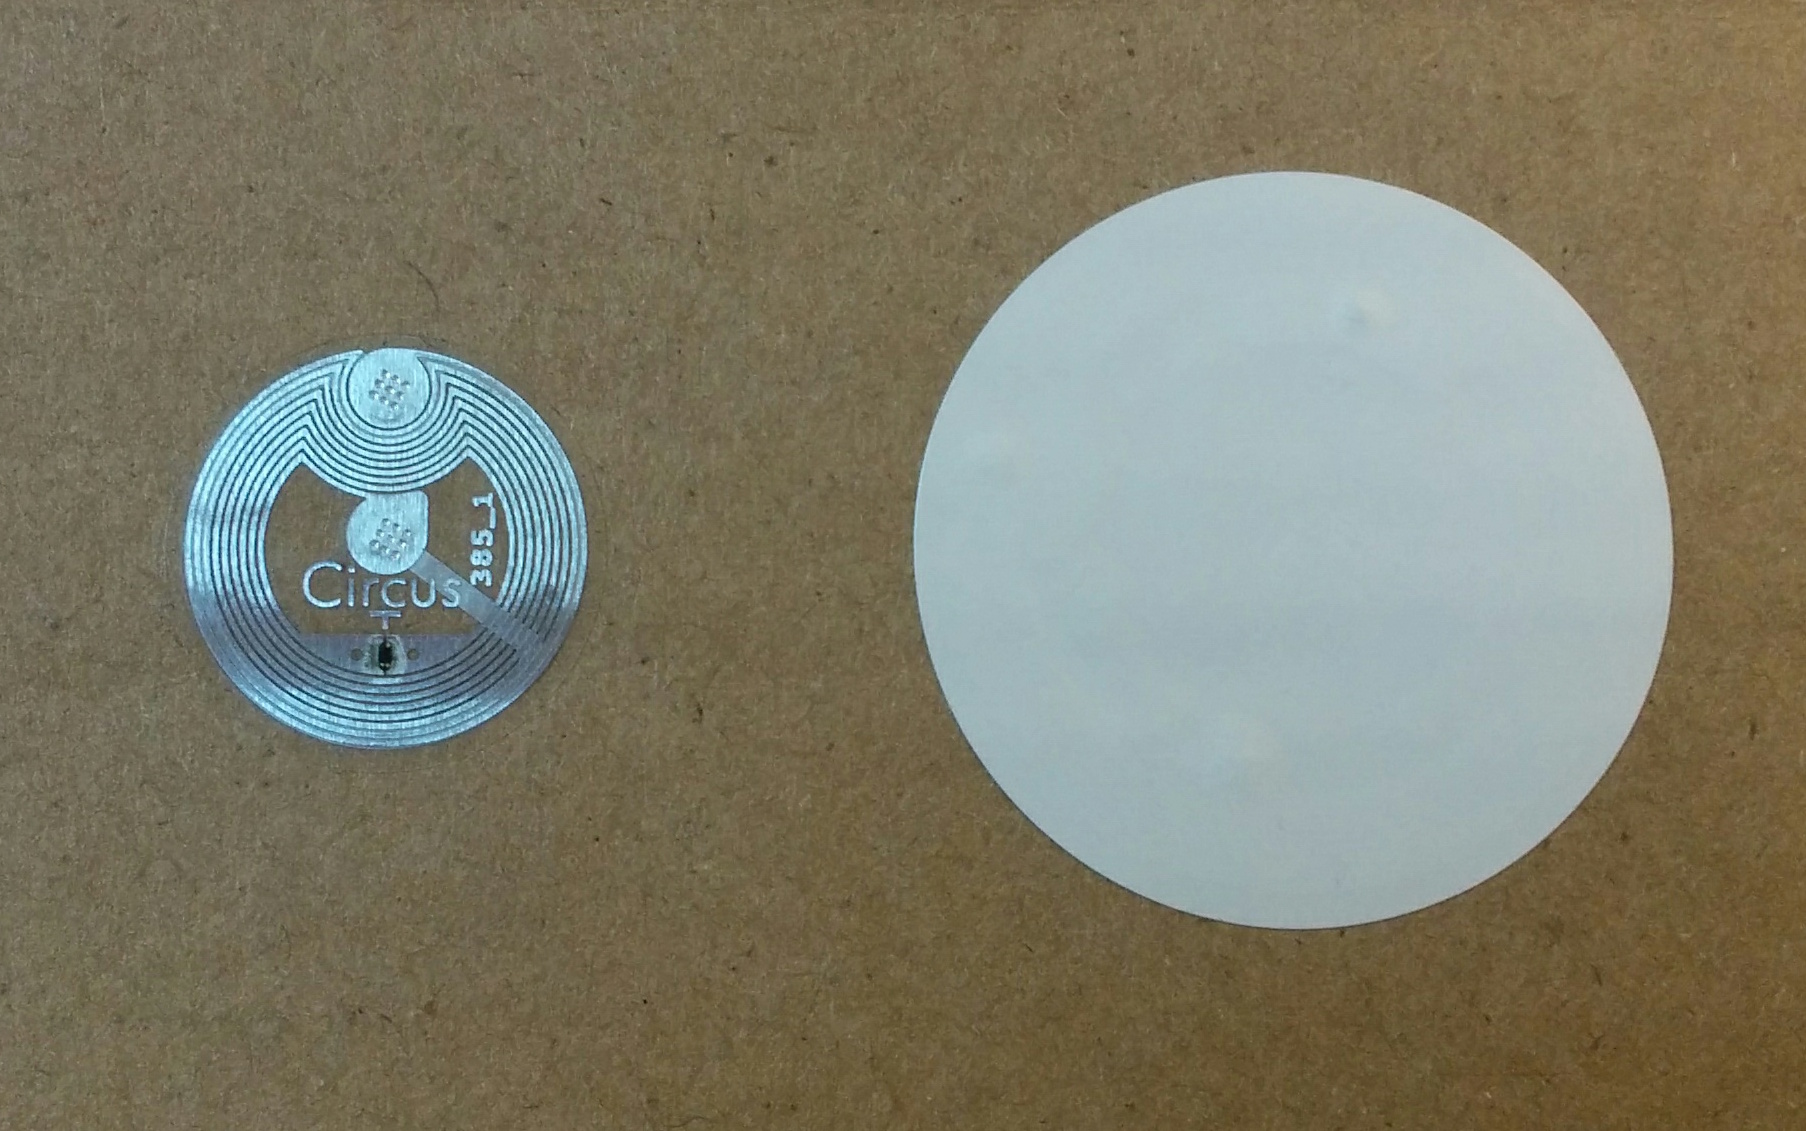
The new tag (smaller, on the left) and the old tag (right)
The most interesting iteration that’s been made overall, I think, is how our exhibition workflow has changed over time to accommodate the Pen. With each new exhibition, we take what sneaked up on us the last time and try to anticipate it. As the most recent exhibition, Beauty’s timeline included more digitally-focused milestones from the outset than any other exhibition yet. Not only did this allow us to anticipate the tag capacity issue many months in advance, but it also gave us more time to double check and fix small problems in the days before opening and gave us more time to try new, experimental approaches to the collections website and post-visit experience. We’re all excited to keep this momentum going as work ramps up on the next exhibitions!